London crime map goes live
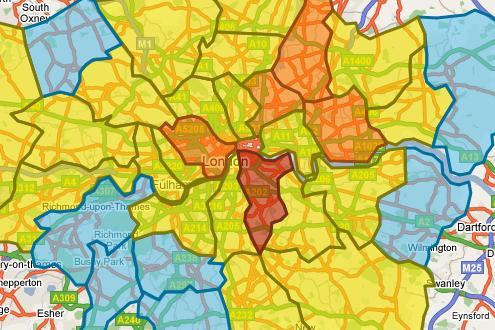
The beta of the Met Police crime map mashup has gone live, and Southwark doesn’t look good.


The Metropolitan Police has launched the first beta version of its nearly London-wide online crime map.
Last month, the Home Office announced that such interactive, street-by-street crime maps would be created for the whole of the UK.
The Met seems to have pipped West Midlands to the post with its release, as the latter force was expected to be the first to go live with such a mapping system in September.
Created with Google Maps, the London beta shows burglary, robbery and vehicle crime rates across the boroughs except for the City of London, which has its own police force by High, Above Average, Average, Below Average and Low. Southwark is the only one to be rated High', while Westminster, Waltham Forest, Hackney and Newham all received Above Average' ratings.
Zoom in or search by post code, and the map breaks down by ward and subwards in each borough, using the same rating system. It also shows monthly crime trends and more detailed comparative statistics by borough and ward, but not by subward - so street-by-street comparisons are not yet possible.
The map uses data to June 2008, and at the moment, only includes burglary, robbery and vehicle crime.
A statement on the map site said the mashup was not complete, and is "intended to test the functionality of crime mapping, with a view to adding further features in the near future, based on your feedback."
Get the ITPro daily newsletter
Sign up today and you will receive a free copy of our Future Focus 2025 report - the leading guidance on AI, cybersecurity and other IT challenges as per 700+ senior executives
There is a form on the site to collect feedback here.
Freelance journalist Nicole Kobie first started writing for ITPro in 2007, with bylines in New Scientist, Wired, PC Pro and many more.
Nicole the author of a book about the history of technology, The Long History of the Future.
-
 Bigger salaries, more burnout: Is the CISO role in crisis?
In-depth CISOs are more stressed than ever before – but why is this and what can be done?
By Kate O'Flaherty Published
-
 Cheap cyber crime kits can be bought on the dark web for less than $25
News Research from NordVPN shows phishing kits are now widely available on the dark web and via messaging apps like Telegram, and are often selling for less than $25.
By Emma Woollacott Published
-
 UK police fails ethical tests with "unlawful" facial recognition deployments
News A University of Cambridge team audited UK police use of the tech and found frequent ethical and legal shortcomings
By Rory Bathgate Published
-
Hackers love the UK, but not for the reason you think
News Ex-Met cyber specialist explains why the UK is such a popular destination for cyber criminals
By Adam Shepherd Published
-
 UK cops to lose access to Europol's cyber crime resources after Brexit
News Cyber cops will be on their own once Britain leaves the EU
By Adam Shepherd Published
-
 Police pursue cloud first IT strategy
News The National Police Technology Council's guidelines attempt to standardise IT deployment
By Clare Hopping Published
-
 NGO director guilty of denying police his device passwords
News Muhammad Rabbani refused to divulge iPhone and MacBook passwords at Heathrow airport
By Zach Marzouk Published
-
 20% of Manchester police rely on Windows XP
News London's Metropolitan Police refused to disclose any up-to-date figures
By Zach Marzouk Published
-
 Should police have powers to sack officers lacking IT skills?
News Reform produces a 10-point plan to address policing's digital skills gap
By Clare Hopping Published
-
 Uber faces criminal investigation over 'Greyball' tool
News DoJ investigates alleged use of software to help drivers evade regulators
By Dale Walker Published