How to use Google Analytics
We explain how your business can get the most out of Google Analytics


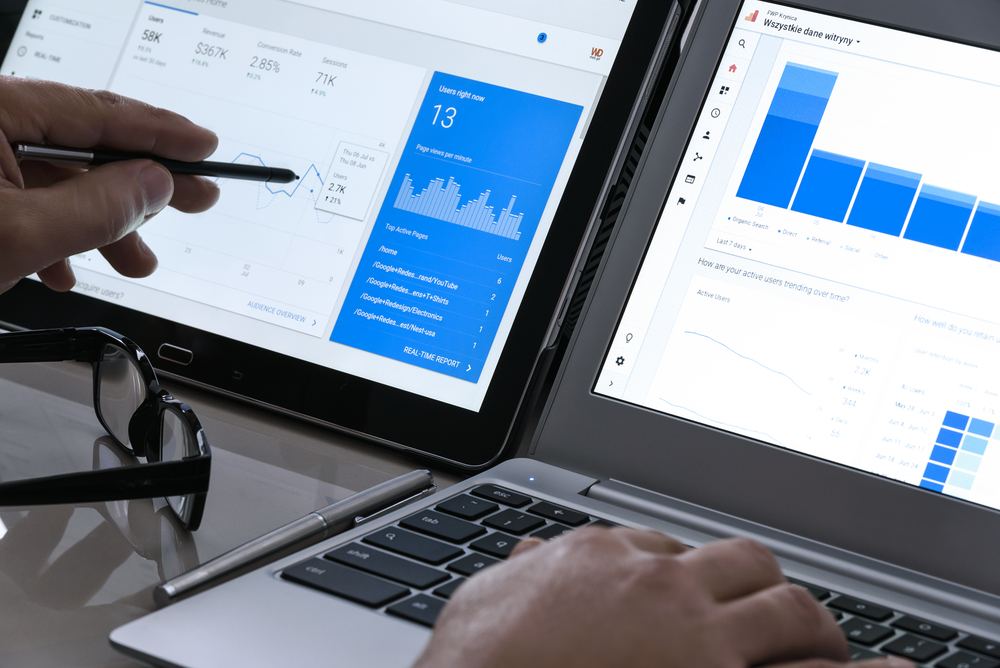
Google Analytics provides detailed information on the performance of a website, helping admins make decisions and allow owners to see how many users they are attracting, where they are coming from, and how they are navigating the site.
By far the most popular site analysis tool, Google Analytics allows for a deep dive into the performance of a site, provided you know how to use all of its various metrics and tools. Unfortunately, the service isn't exactly the most user-friendly, and it's perfectly possible for new users to misunderstanding certain tools, or misinterpret data presented to them.
Given its complexity, it's worth breaking down how to use Google Analytics, starting with tips on how to set it up.
How to set up Google Analytics
Before you can start taking advantage of this powerful analysis tool, you'll need a Google account. You can use either a Gmail account, or an account you use to access Google Apps, or set up a new one from scratch.
You'll be asked for these details when accessing the analytics website - analytics.google.com. Once you're signed in, you will be asked for information relating to the nature of your website, such as its name, the industry in which it operates, the country in which it operates, and how you would like Google Analytics to function on your site.
There are a number of different options here, but perhaps the most straightforward method is to add the tracking code into your site's header, if you have access to it, otherwise you can verify it through third-party hosters (such as GoDaddy).
Once all your information is added and the setup is configured, you should begin to see data trickle into the Google Analytics pane on your account.
Sign up today and you will receive a free copy of our Future Focus 2025 report - the leading guidance on AI, cybersecurity and other IT challenges as per 700+ senior executives
It's important to set goals if you want Google to let you know when something important happens as part of your KPIs (such as when someone completed a payment on your site, signs up to a newsletter, creates an account, or custom goals) and also, to exclude the IP addresses of your employees so all the data comes from genuine customers.
To set goals, head to the Goals section from the View column in the Admin dashboard choose New goal and select the option that's most relevant to your goal. Give it a name, choose the options relevant to your goal (such as a certain destination, duration of an action or more) and create the goal.
To exclude IP addresses so only genuine visits are tracked, you'll need to set up an IP address filter. You can do this for individual IP addresses, or subnet IP addresses if your business uses a variety of different addresses.
Go to the admin panel, select the account you want to create a filter in and select All filters from the Account column. Choose New filter then Create a new filter and name it something recognisable (such as IP address exclusion). Choose the Predefined filter type and from the Select filter type drop-down menu, select Exclude. Click the Select source or destination drop-down menu and select traffic from the IP addresses. Now choose whether you want to exclude individual addresses (that are equal to) or multiple subnet IP addresses (that begin with).
Enter the IP address(es) that you want to exclude or the beginning of the IP address if you're entering subnet addresses and save the filter.
Setting up a personalised dashboard
Google Analytics provides so many important insights, but it can be very complicated. That's why it's key to set up your Google Analytics dashboard for your business so the most important metrics can be viewed instantly.
When you first head to Google Analytics, you'll arrive at the dashboard. To edit the information shown on here, you can head to Reports, choose Customisation and then Dashboards.
Select to choose New Dashboard and opt for the blank canvas option to create your fully tailored dashboard. Give it a name and you can start positioning the widgets most important for your company reporting.
You can choose standard widgets that present the information numerically, while a timeline will offer that information in a graph so you can track changes over time.
A geo map shows how the data is spread geographically, pie gives the breakdown of a data point as a share of traffic and bar chart plots two data points against each other.
You can also choose real-time widgets or standard widgets, the latter which shows past data.
Dale Walker is a contributor specializing in cybersecurity, data protection, and IT regulations. He was the former managing editor at ITPro, as well as its sibling sites CloudPro and ChannelPro. He spent a number of years reporting for ITPro from numerous domestic and international events, including IBM, Red Hat, Google, and has been a regular reporter for Microsoft's various yearly showcases, including Ignite.
-
 I couldn’t escape the iPhone 17 Pro this year – and it’s about time we redefined business phones
Opinion ITPro is back on smartphone reviews, as they grow more and more intertwined with our work-life balance
-
 The gig economy: Past, present, and future
Feature The rise of the gig economy represents a new era of flexible working despite being plagued with controversies