Google Sheets adds machine learning for natural language charts
New tools should make Google Sheets easier to use and more powerful


Pulling data out of complicated spreadsheets isn't easy for amateur data scientists, but such analysis is a requirement for many modern roles.
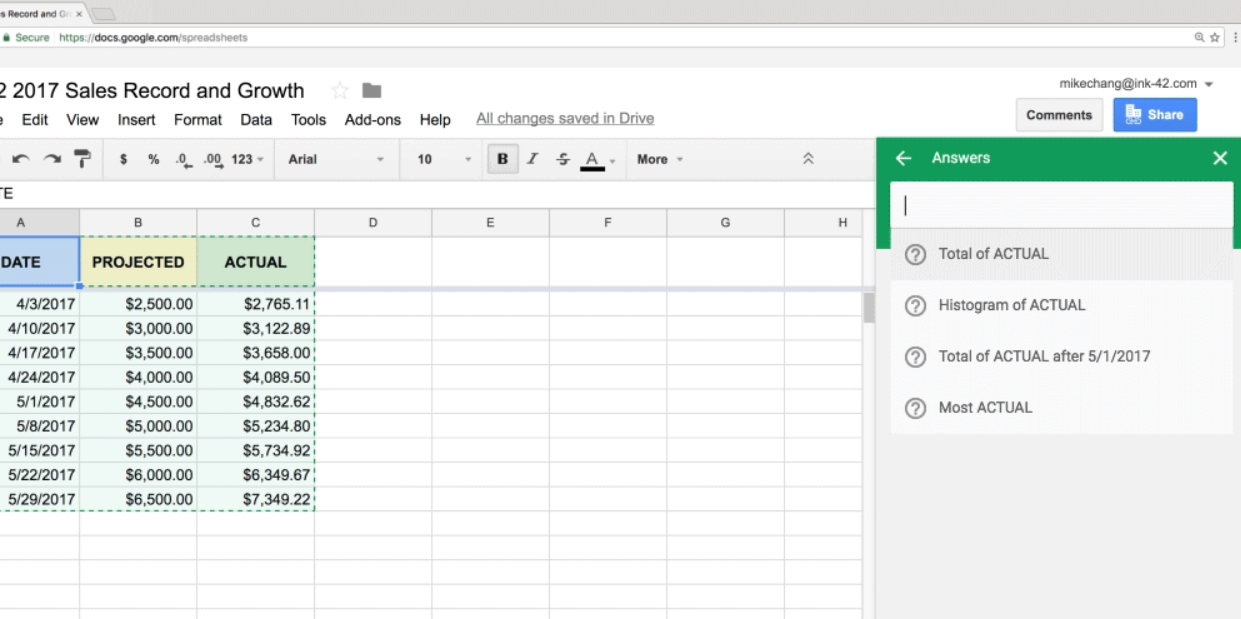
Google has stepped in to help by adding machine learning tools to Sheets to let you ask questions about your spreadsheet in natural language, rather than using complicated calculations or understanding jargon.
"Explore in Sheets, powered by machine learning, helps teams gain insights from data, instantly. Simply ask questions in words, not formulas to quickly analyse your data," said Daniel Gundrum, Sheets product manager, in a post in the Google blog. "For example, you can ask 'what is the distribution of products sold?' or 'what are average sales on Sundays?' and Explore will help you find the answers."
Now, we're using the same powerful technology in Explore to make visualising data even more effortless. If you don't see the chart you need, just ask," Gundrum said. "Instead of manually building charts, ask Explore to do it by typing in 'histogram of 2017 customer ratings' or 'bar chart for ice cream sales.' Less time spent building charts means more time acting on new insights."
There are more updates to make life in Sheets easier. Charts made in Sheets will automatically sync in Docs and Slides, saving you that extra step when you have fresh figures. Just click the "update" button to sync data.
Other changes include new keyboard shortcuts - you can now delete a row with "Ctrl+-" - as well as a revamped printing interface for easier settings management, new chart editing tools, and more spreadsheet functions.
Get the ITPro daily newsletter
Sign up today and you will receive a free copy of our Future Focus 2025 report - the leading guidance on AI, cybersecurity and other IT challenges as per 700+ senior executives
Freelance journalist Nicole Kobie first started writing for ITPro in 2007, with bylines in New Scientist, Wired, PC Pro and many more.
Nicole the author of a book about the history of technology, The Long History of the Future.
-
 Should AI PCs be part of your next hardware refresh?
AI PCs are fast becoming a business staple and a surefire way to future-proof your business
By Bobby Hellard Published
-
 Westcon-Comstor and Vectra AI launch brace of new channel initiatives
News Westcon-Comstor and Vectra AI have announced the launch of two new channel growth initiatives focused on the managed security service provider (MSSP) space and AWS Marketplace.
By Daniel Todd Published
-
 'Digital hide-and-seek': Workers are wasting hundreds of hours a year sourcing the information they need to carry out their role
News Knowledge workers globally are wasting a quarter of their working week tracking down information, new research from Atlassian has revealed.
By George Fitzmaurice Published
-
 Untethered: How CIOs and CISOs are paving the way for the new hybrid workforce
Whitepaper Effective techniques to transition from exposed legacy infrastructure to an effective zero trust strategy
By ITPro Published
-
 Unlocking the power of your digital services
Sponsored Businesses have invested significant cash into technology since COVID-19, but are they really getting their money's worth?
By ITPro Published
-
 Delivering fast and secure digital experiences for the modern hybrid workforce
Whitepaper A new approach to digital experience monitoring that can monitor the health of all systems
By ITPro Published
-
 Collaboration is the glue that holds your business together
SPONSORED A combination of productivity tools and cloud telephony can enable the best from your workforce
By ITPro Published
-
 The future of work and the forgotten workforce
whitepaper How to deploy a mobile-first strategy so no one gets left behind
By ITPro Published
-
 The case for an accelerated device refresh cycle
Whitepaper Achieving a more cost-effective device lifecycle overall
By ITPro Published
-
 Employees are choosing how they work
Whitepaper And with the right secure digital strategy, this could be a great thing for your business: today and far into the future
By ITPro Published