Park Place Technologies Entuity review: A great network monitoring contender
This easily deployed network monitoring software scores highly for its rich set of features and smartly designed web console
-
+
Good value
-
+
Simple device-based licensing
-
+
Easy deployment
-
+
Versatile dashboards
-
+
Includes IPAM
-
+
Flow monitoring and configuration management as standard
-
-
Network discovery may require some additional manual work

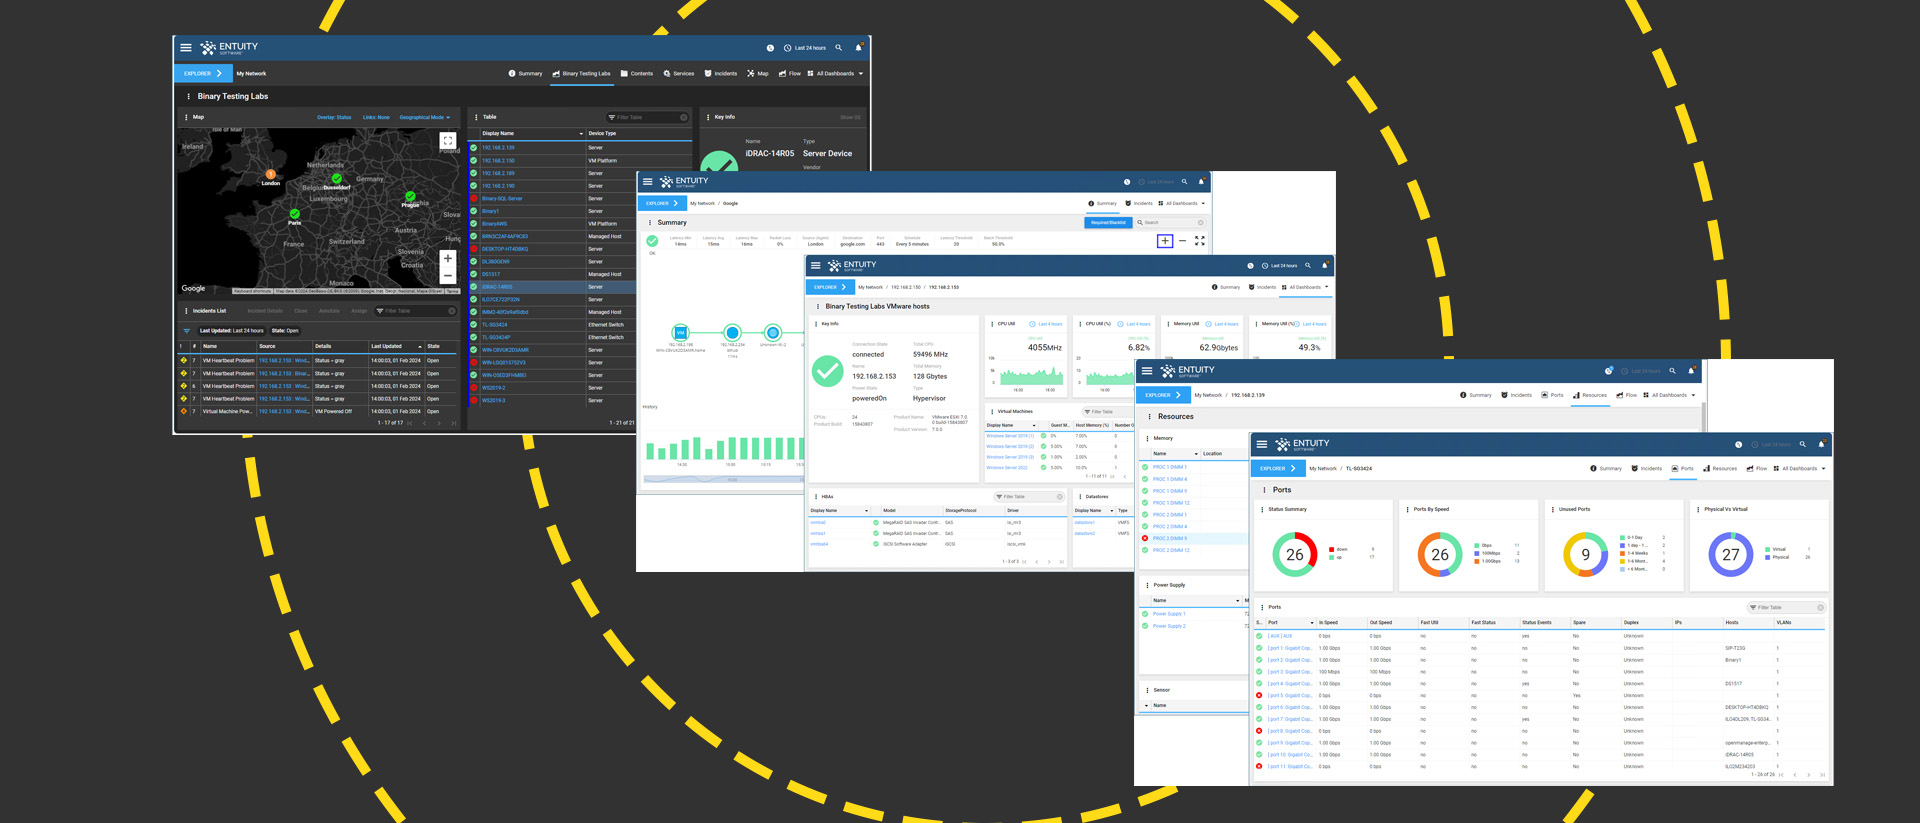
Businesses are faced with an enormous choice of network monitoring products and Park Place Technologies aims to rise to the top for a number of sound reasons. The company has a keen focus on providing global managed IT services but its Entuity software delivers an extensive range of network monitoring features for those that want to keep it all on-premises.
Another compelling argument is Entuity's licensing as this is based purely on the number of monitored devices regardless of how many components each one has. The base product also comes with a lot of features other vendors charge extra for making Entuity's yearly costs of $150 per device look very affordable.
Many competitors insist on using confusing licensing schemes based on elements, sensors, interfaces, disk volumes, and even points systems. As we know from experience, these types of licenses can get used up very quickly, especially if you're monitoring high-density switches or storage arrays, making them a potentially expensive option.
Park Place Technologies Entuity review: Deployment and discovery
Entuity can be hosted on Red Hat Enterprise Linux, Oracle Linux, or Windows Server 2019/2022 platforms. Host system hardware requirements are quite modest and SMBs with smaller networks can get away with a 6-core Xeon E3 CPU, 6GB of memory, and 60GB of hard disk space.
We took the virtualization route and loaded it on a Windows Server 2022 VM on the lab's VMware ESXi 7 host. Installation is swift and we liked the fact that the image file checksum needed to be validated with the supplied hash files first to ensure they hadn't been tampered with. You don't need to source a production database either, as the MariaDB version included with Entuity is sufficient for all sizes of environments.
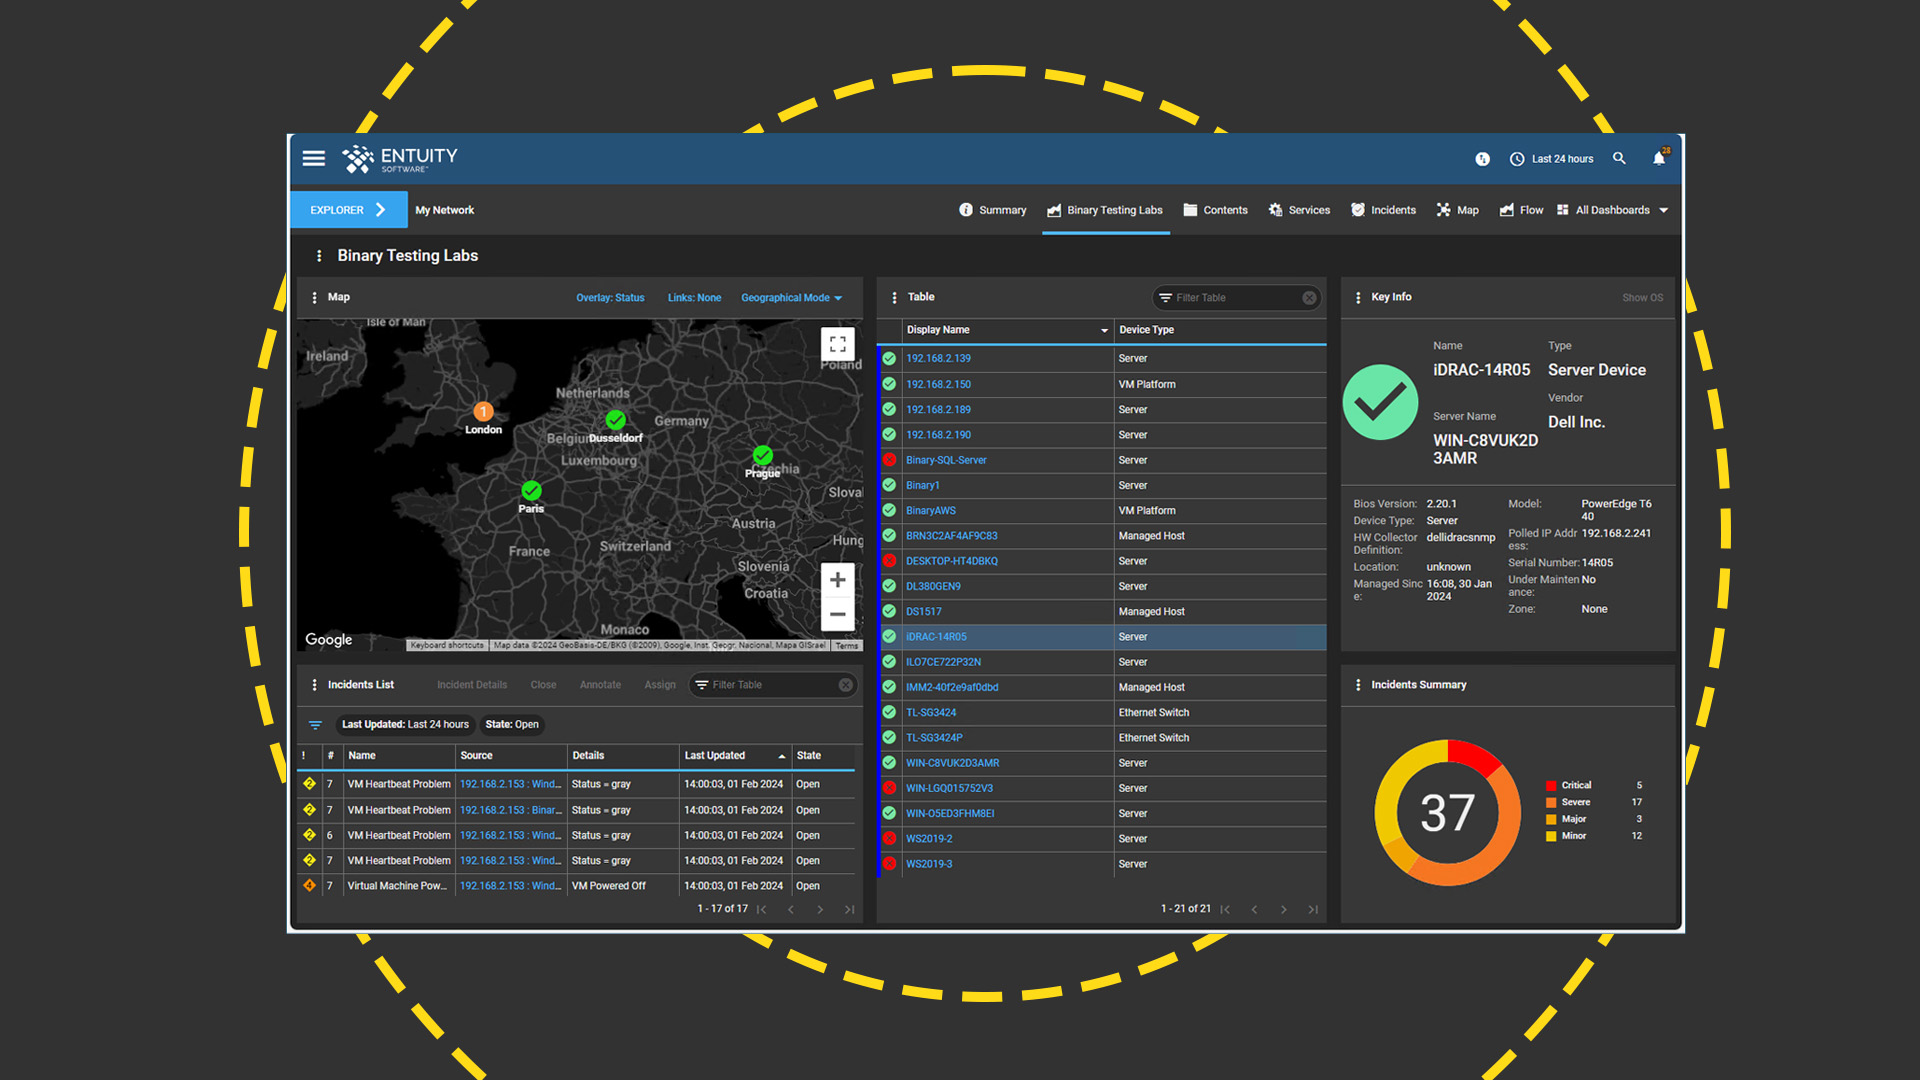
The Entuity web console is nicely designed and our first task was to set up a list of device credentials and run discoveries from the asset management page. These can be scheduled to run regularly and the process is fast with Entuity taking five minutes to scan our lab subnet and report back with a detailed list of all our systems.
Some manual intervention may be needed as the discovery didn't correctly identify the iLO management controllers in our HPE servers. For these, we added them individually using Entuity's specific HPE iLO SNMP asset type – it also supports iLO Rest connections.
Park Place Technologies Entuity review: Dashboards and details
Entuity is capable of presenting a vast amount of information and it can all be refined with customized dashboard views. Out of the box, Entuity provides nearly 100 and you can add your own static or dynamic dashboards by selecting any of these, duplicating and editing them, or creating new ones.
Metrics are added to a dashboard as 'dashlets', dragged around the Entuity design canvas to the desired position, previewed, and saved. Individual dashlets can be linked to others in the same dashboard and you can decide which Entuity users are permitted to view them.
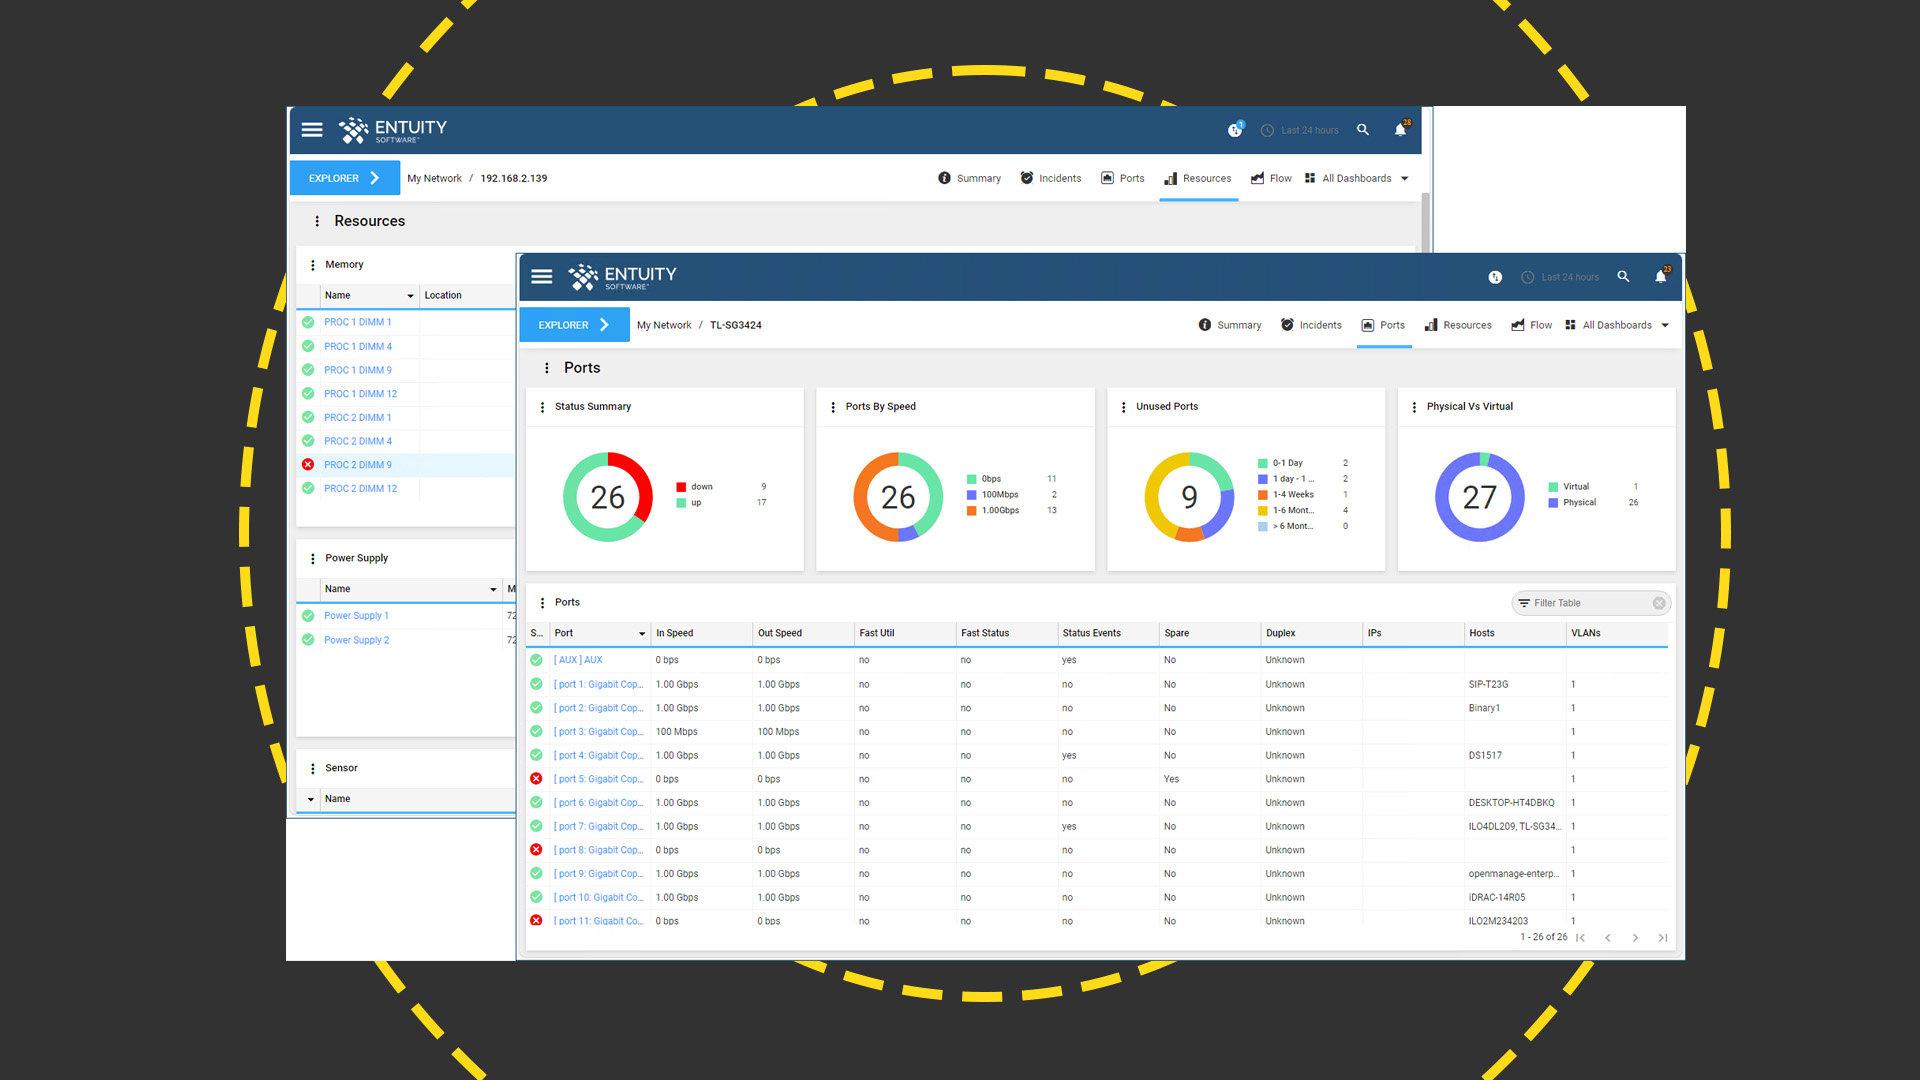
The asset management page provides a view of all discovered devices, their status, name, IP address, and so on, and clicking on an entry transports you to a summary dashboard that presents all information Entuity has gathered about it. For our Windows servers, we could see the OS version along with current incidents and swapping to the hardware view presented hardware resource utilization graphs plus details of network ports and logical volumes.
RELATED WHITEPAPER

The network switch dashboard is very informative as the real-time summary view shows incidents, CPU and memory utilization plus latency and SNMP response times. Move to the ports tab and its predefined dashboard presents pie charts for port status, a breakdown of their connection speeds and unused ports, and the time they've been inactive while the table below shows what devices are attached to each one.
Our VMware vSphere host dashboard included charts for performance, vSwitches, datastores, hypervisors, and clusters. Selecting our ESXi 7 hypervisor presented a wealth of data about its hardware plus the status of all VMs and the best part was this was all presented by the default dashboard.
Likewise with our HPE iLO4/5/6 and Dell iDRAC9 controllers as their default dashboards showed every server hardware component and their status. These came in handy as Entuity drew our attention to a faulty DIMM module in one of our HPE servers that we hadn't previously noticed.
Park Place Technologies Entuity review: Action stations
You'll want to be notified promptly when there's a problem and Entuity's event administration provides the tools to create notification projects that link traps, events, and incidents with rules, variables, and conditions which are then assigned to actions. For the latter, there are plenty to choose from including email, ServiceNow, Slack, Splunk, and BMC Helix with support included for posting alerts in Cisco's DNAC, Meraki, and Microsoft Teams channels via incoming webhooks.
Value gets a boost as the price includes integrated IPAM (IP address management) services and basic Flow analysis where Entuity automatically accepts data from Flow sources and presents it in a dashboard with a choice of views such as the top conversations, applications, protocols, and ports. Even configuration management is included as standard where Entuity regularly backs up configuration files on selected devices, compares versions, and highlights any changes or differences.
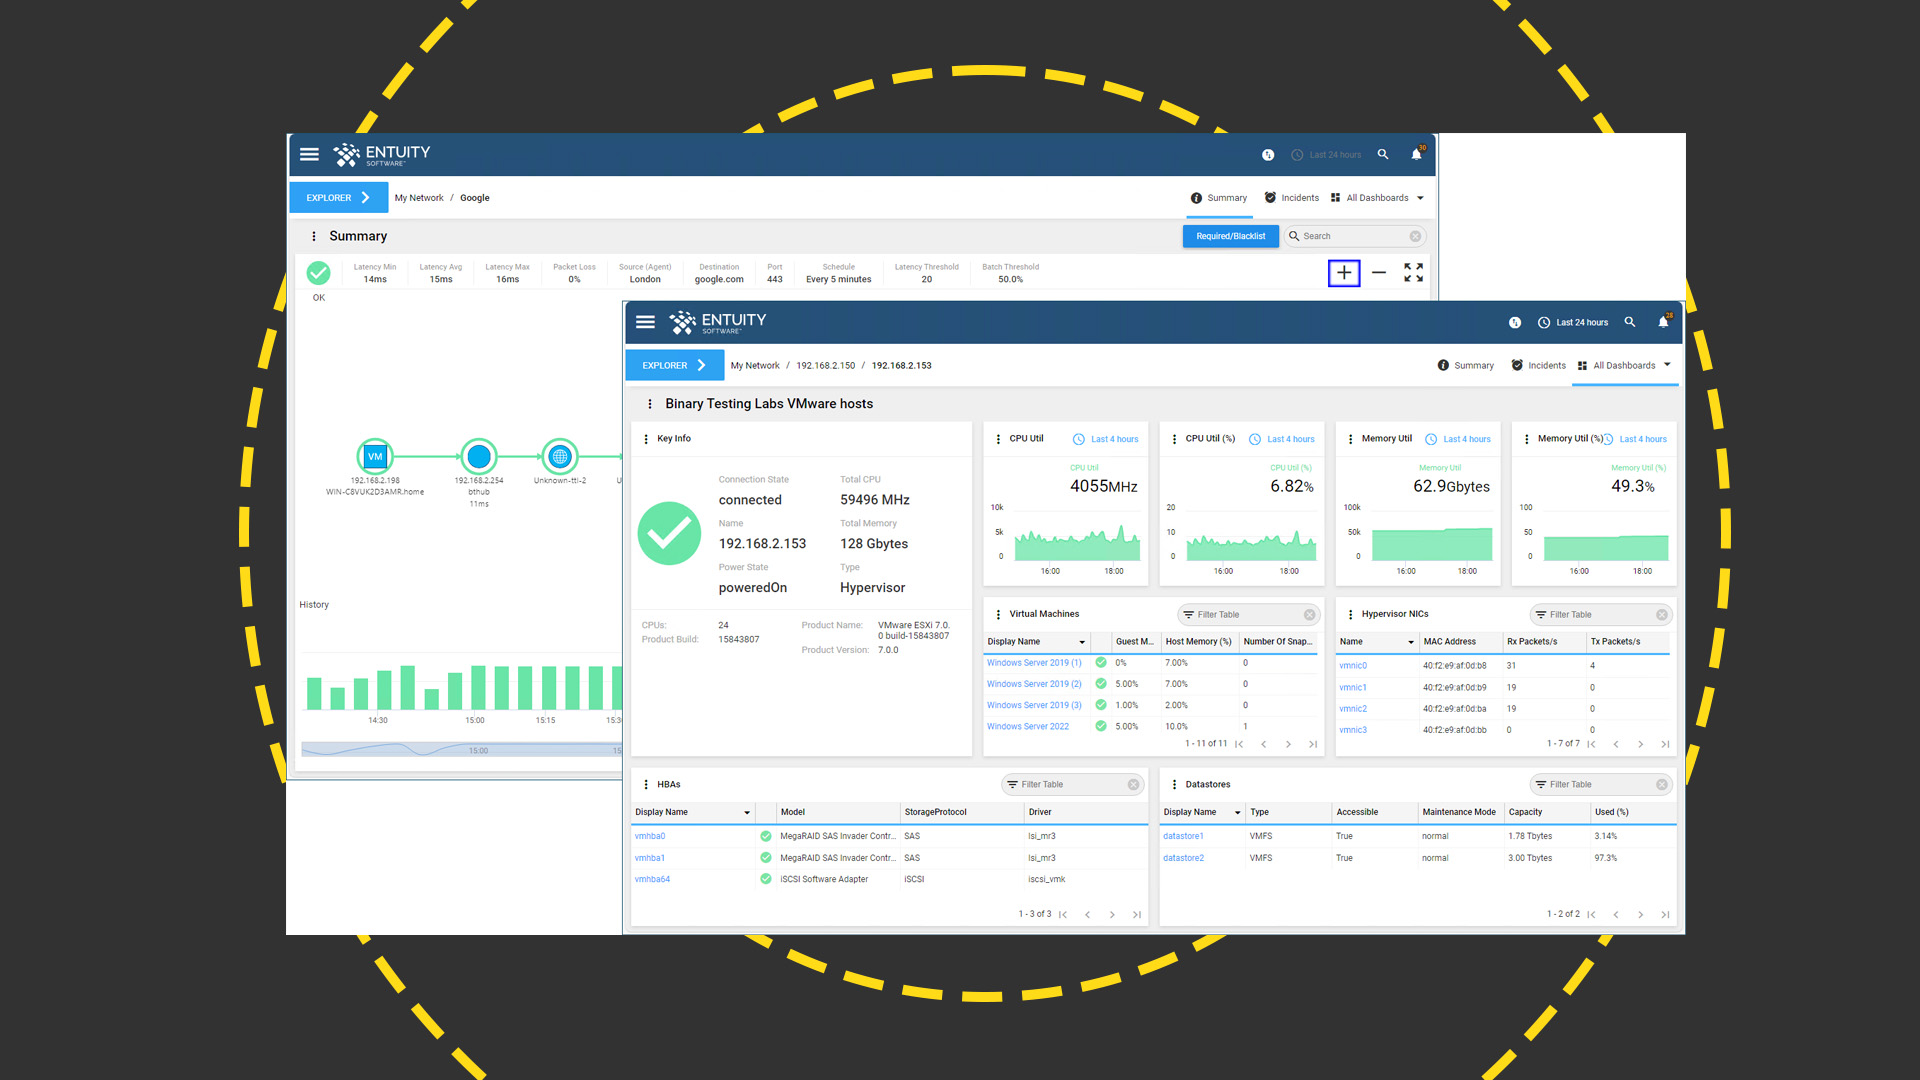
Cloud service monitoring is another integral feature and we had no problems creating a new asset for our AWS EC2 account and monitoring performance and availability of our cloud instances. Entuity's SurePath is an additional feature licensed by the number of paths but it's worth considering as it helps you stay on top of cloud service performance issues as SurePath agents monitor external web locations and provide hop-by-hop maps with latency and packet loss details.
Entuity delivers a large toolbox of network monitoring services all easily managed from a central web console that offers an incredible range of informative dashboards. Its simple device-based licensing makes it affordable for SMBs and enterprises alike and value looks even better as the base price includes many valuable features some other vendors charge extra for.
Get the ITPro daily newsletter
Sign up today and you will receive a free copy of our Future Focus 2025 report - the leading guidance on AI, cybersecurity and other IT challenges as per 700+ senior executives
Dave is an IT consultant and freelance journalist specialising in hands-on reviews of computer networking products covering all market sectors from small businesses to enterprises. Founder of Binary Testing Ltd – the UK’s premier independent network testing laboratory - Dave has over 45 years of experience in the IT industry.
Dave has produced many thousands of in-depth business networking product reviews from his lab which have been reproduced globally. Writing for ITPro and its sister title, PC Pro, he covers all areas of business IT infrastructure, including servers, storage, network security, data protection, cloud, infrastructure and services.
-
 Cleo attack victim list grows as Hertz confirms customer data stolen – and security experts say it won't be the last
News Hertz has confirmed it suffered a data breach as a result of the Cleo zero-day vulnerability in late 2024, with the car rental giant warning that customer data was stolen.
By Ross Kelly Published
-
 Women show more team spirit when it comes to cybersecurity, yet they're still missing out on opportunities
News While they're more likely to believe that responsibility should be shared, women are less likely to get the necessary training
By Emma Woollacott Published
-
 OpenAI wants developers using its new GPT-4.1 models – but how do they compare to Claude and Gemini on coding tasks?
News OpenAI says its GPT-4.1 model family offers sizable improvements for coding, but tests show competitors still outperform it in key areas.
By Ross Kelly Published