SolarWinds Network Performance Monitor 12 review
The best network monitoring tool on the market just got even better


NPM delivers a wealth of troubleshooting tools wrapped up neatly in a slick new console
-
+
Swift deployment; Quality monitoring and alerting; Highly scalable; Innovative QoE and NetPath features; Good value
-
-
Element-based pricing can spiral out of control

Businesses are spoilt for choice when it comes to network monitoring, yet Solarwinds' Network Performance Monitor (NPM) has always been a favourite of ours. It's affordable, easy to deploy and capable of providing a huge amount of information about devices and network performance as well as problem diagnosis.
NPM's licensing is based on elements' which can be anything from a node or volume to a network interface or CPU. One polling engine is installed on the NPM host and can monitor up to 12,000 elements.
If you're rich enough to afford F5 load balancers, then you can now use NPM 12 to monitor them. The new NetPath tool also speeds up problem resolution using probes to discover and map paths to remote systems and services.
Quick deployment
We loaded NPM on an HPE ProLiant DL20 Gen9 Xeon E3 v5 rack server running Windows Server 2012 R2. Deployment was swift - a wizard ran through entering IP addresses and subnets to monitor, adding various system credentials and scheduling network discoveries.
If you have Windows servers, and particularly Hyper-V hosts, we recommend changing the default polling method from SNMP to WMI. NPM will use WMI first and drops back to SNMP for devices that don't support it.
It's worth deciding what to monitor as element licenses can get eaten up quickly. Our lab network had over thirty systems including Windows servers, VMware and Hyper-V hosts, switches plus NAS appliances and NPM used up 267 network elements for all of them.
A new console
The new console hasn't changed massively, so existing users won't have any problems navigating it. The main difference is the menu bar has been tidied up making it easier to access dashboards, alerts, reports and settings.
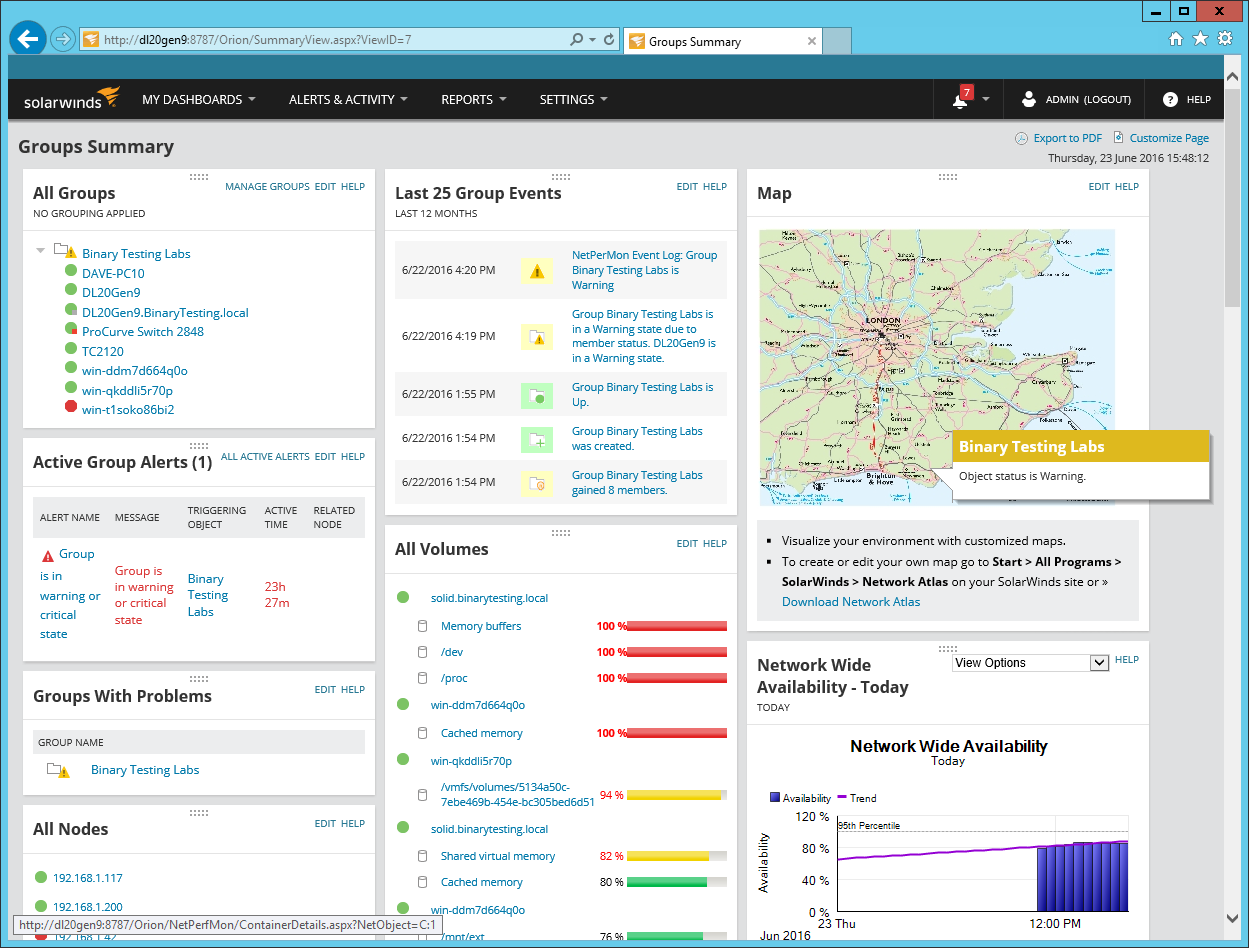
NPM's new console can be easily customised to suit
The console opens with a summary of all network activity along with colour-coded device icons. We didn't even need to configure alerts and thresholds as the default settings appeared to be doing a fine job.
At all levels, the console can be customised allowing us to play with views and get them just right. Extra columns can be added and, with a few mouse clicks, we selected more resource views and placed them where we wanted them.
Any device showing an alert can be selected from the dashboard and drilled down into for more information. Alerts can be linked to devices and dynamic groups, while conditional group dependencies stop alert floods if a core device fails.
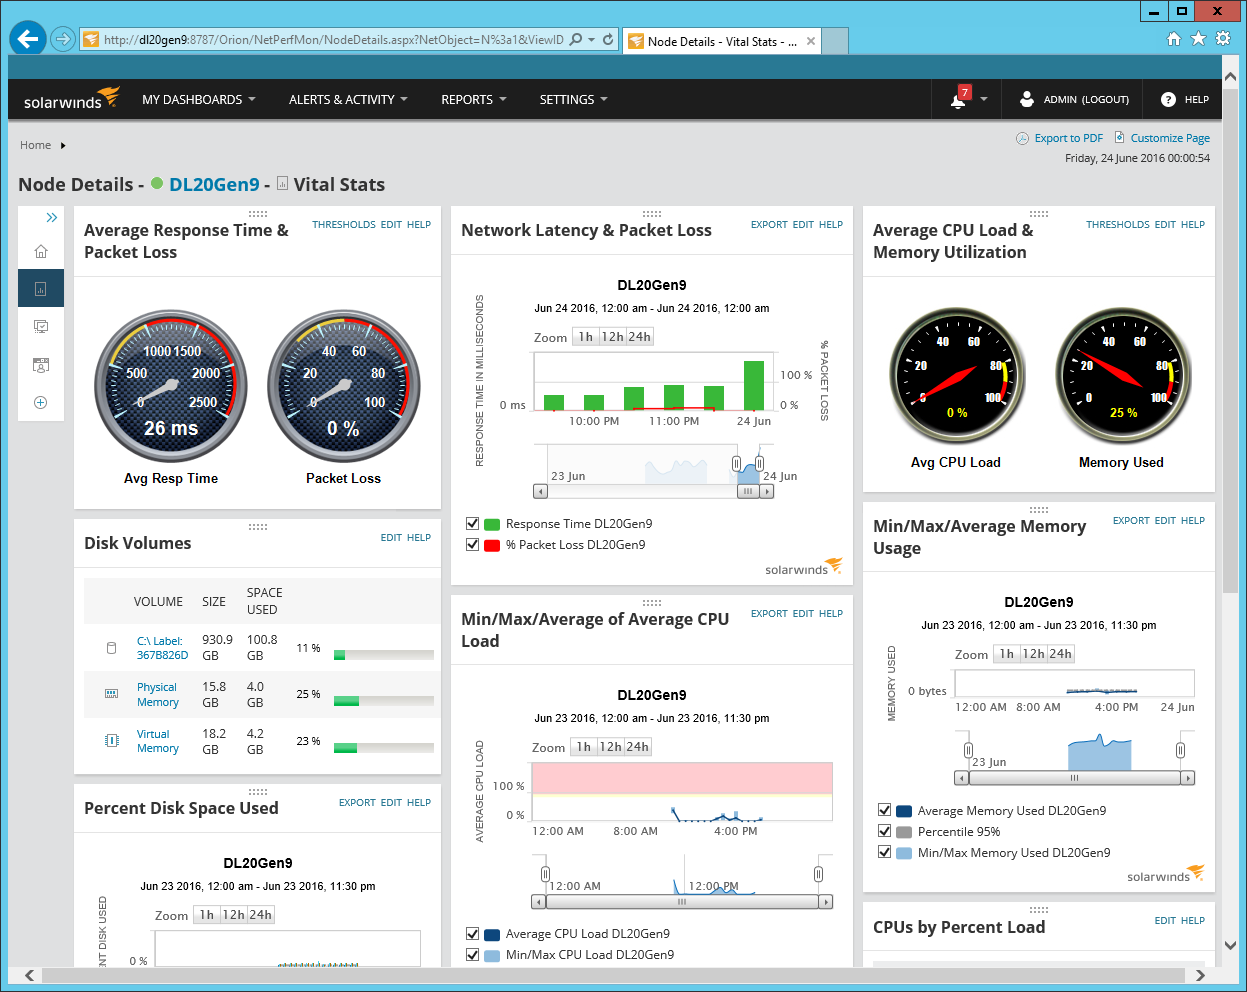
We could drill down and see a wealth of information about individual nodes
Are you experienced?
NPM's Quality of Experience (QoE) feature uses packet sensors to identify, categorise and analyse application traffic. We deployed a sensor on the NPM host and connected it to a mirror port on our HP switch so it could see all network traffic.
The sensor recognises traffic for over 1,200 predefined apps and presents its findings in customisable views. The amount of information is staggering as NPM automatically identified any apps it found and reported back on activities such as HTTP, FTP, CIFS, Exchange, SQL, POP3 and SMTP.
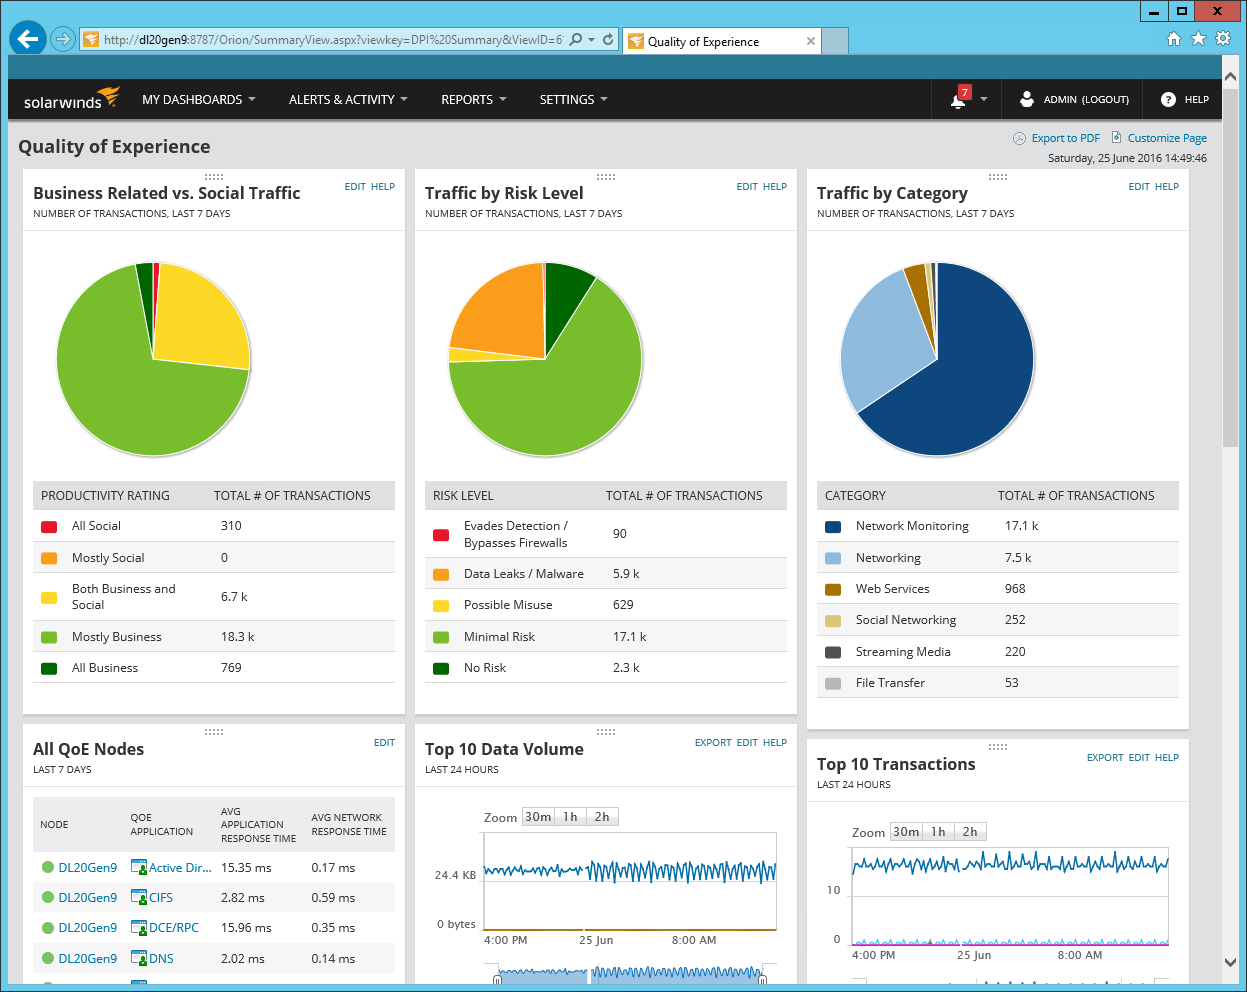
NPM's QoE keeps you in the know about application performance
Facebook users won't escape its gaze and we could also monitor LinkedIn, GoToMyPC and Amazon Web Services activity. The QoE console shows app response times, transactions or data volumes and neatly separates traffic into graphs showing business, social and potentially risky categories.
NPM scores for its integral virtualisation monitoring tools and it had no problems identifying our VMware vCenter host so we could its vitals and VM status. It's worth noting once again that we had to change NPM's polling method from SNMP to WMI/ICMP before it could identify our Hyper-V host.
For Hyper-V host monitoring, NPM is superior to Ipswitch's WhatsUp Gold which doesn't have any integrated virtualisation features. You can work around this by using Ipswitch's application performance monitor (APM) module, but this is an optional feature that costs extra.
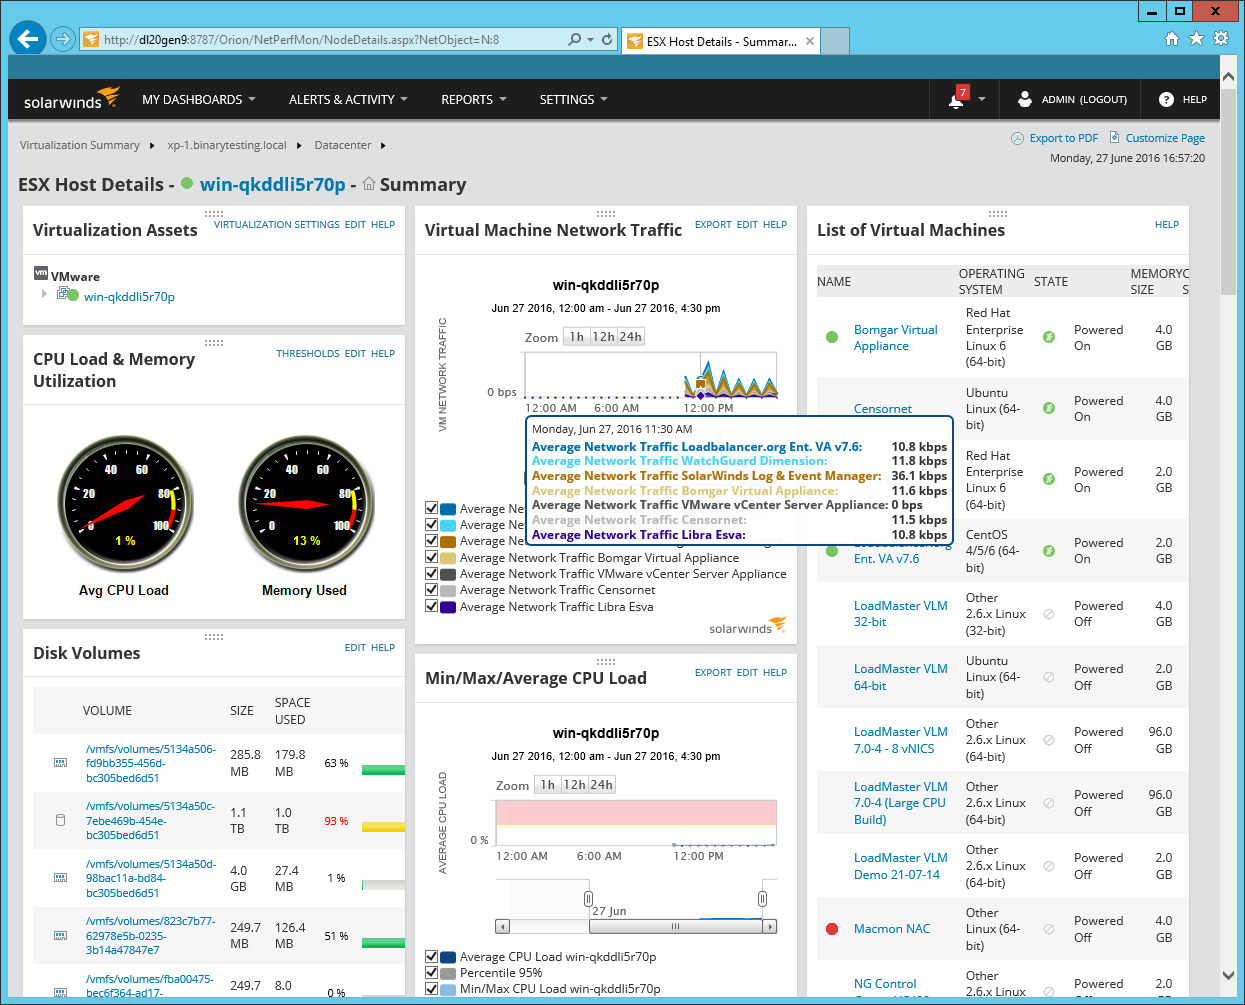
NPM provides good virtualization monitoring tools as standard
Wireless and NetPath
NPM monitors wireless networks and shows SSIDs, active clients, traffic and signal strength but there is a catch. Along with the wireless heat map, most features are only supported by Cisco, HPE, Fortinet, Ruckus and Motorola APs.
We use Netgear ProSafe WAC720 APs in the lab which NPM discovered and added to the dashboard's wireless pane. It showed the APs' 2.4GHz and 5GHz radios along with interface utilisation and throughput, but was unable to list SSIDs or connected wireless clients.
We found NetPath perfect for monitoring service performance as it uses probes to provide a hop-by-hop map. For each hop it shows latency and packet loss. It can even show the owner of external nodes.
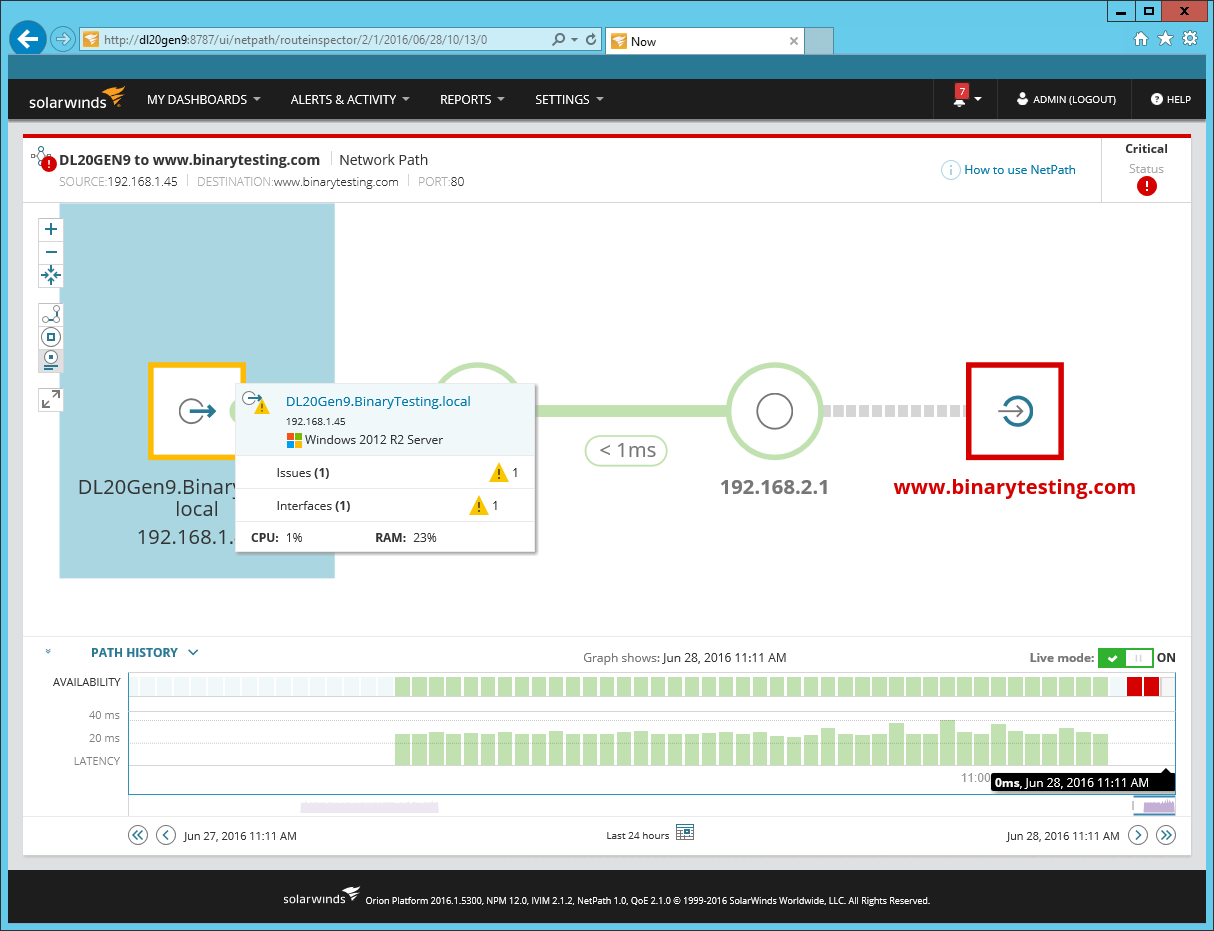
NetPath provided swift problem resolution for our external web sites
For probe creation, you enter a destination IP address or hostname and choose a probing interval. We tested it with our external web site and within seconds, NetPath had produced a map with all hops. When we cut the lab's Internet access, it showed precisely where the fault had occurred.
Conclusions
As long as you keep a firm grip on element usage and thus licensing costs, NPM is good value. It's easy to deploy and can provide a wealth of information about networks of all shapes and sizes.
Its embedded support for virtualised environments is a cut above the rest and the refreshed web console makes for swift problem diagnosis. QoE is a real winner and the new NetPath feature makes it even more versatile - network troubleshooting doesn't get any easier than this.
Verdict
NPM delivers a wealth of troubleshooting tools wrapped up neatly in a slick new console
Requires Windows Server 2008 R2 SP1 or later
Get the ITPro daily newsletter
Sign up today and you will receive a free copy of our Future Focus 2025 report - the leading guidance on AI, cybersecurity and other IT challenges as per 700+ senior executives
Dave is an IT consultant and freelance journalist specialising in hands-on reviews of computer networking products covering all market sectors from small businesses to enterprises. Founder of Binary Testing Ltd – the UK’s premier independent network testing laboratory - Dave has over 45 years of experience in the IT industry.
Dave has produced many thousands of in-depth business networking product reviews from his lab which have been reproduced globally. Writing for ITPro and its sister title, PC Pro, he covers all areas of business IT infrastructure, including servers, storage, network security, data protection, cloud, infrastructure and services.
-
 Westcon-Comstor and Vectra AI launch brace of new channel initiatives
News Westcon-Comstor and Vectra AI have announced the launch of two new channel growth initiatives focused on the managed security service provider (MSSP) space and AWS Marketplace.
By Daniel Todd Published
-
 Third time lucky? Microsoft finally begins roll-out of controversial Recall feature
News The Windows Recall feature has been plagued by setbacks and backlash from security professionals
By Emma Woollacott Published
-
 The UK government wants quantum technology out of the lab and in the hands of enterprises
News The UK government has unveiled plans to invest £121 million in quantum computing projects in an effort to drive real-world applications and adoption rates.
By Emma Woollacott Published