AdRem NetCrunch 10.4 review: A monitoring pack for every occasion
Fast and affordable network monitoring with a wealth of device information


AdRem’s NetCrunch 10.4 offers a remarkable set of network monitoring tools and the new features make it even more versatile. The node-based licensing scheme is affordable for SMBs, deployment is a swift 15-minute task and its highly informative management console means never missing a network problem again.
-
+
Lightning-quick deployment; Good hardware support; Heaps of monitoring packs
-
-
Hyper-V VM monitoring still limited

AdRem Software has taken network monitoring to the next level, and its NetCrunch 10.4 introduces a wealth of new features. It employs predefined 'monitoring packs' to group together common sets of performance monitors with alert conditions and this latest release adds 32 new ones, bringing the total to 187.
NetCrunch can now keep a close eye on security devices from Cisco, Fortinet, Juniper and SonicWALL plus NAS appliances from Buffalo, Netgear, Qnap and Synology. Server monitoring sees big improvements too, as AdRem has added packs for Dell EMC iDRAC, Fujitsu iRMC, HPE iLO and Lenovo IMM remote management controllers.
A feature that has always impressed us is how quickly NetCrunch can start monitoring your network. We installed it on a Windows Server 2016 host, followed the discovery wizard and had a complete readout of our lab network in 15 minutes.
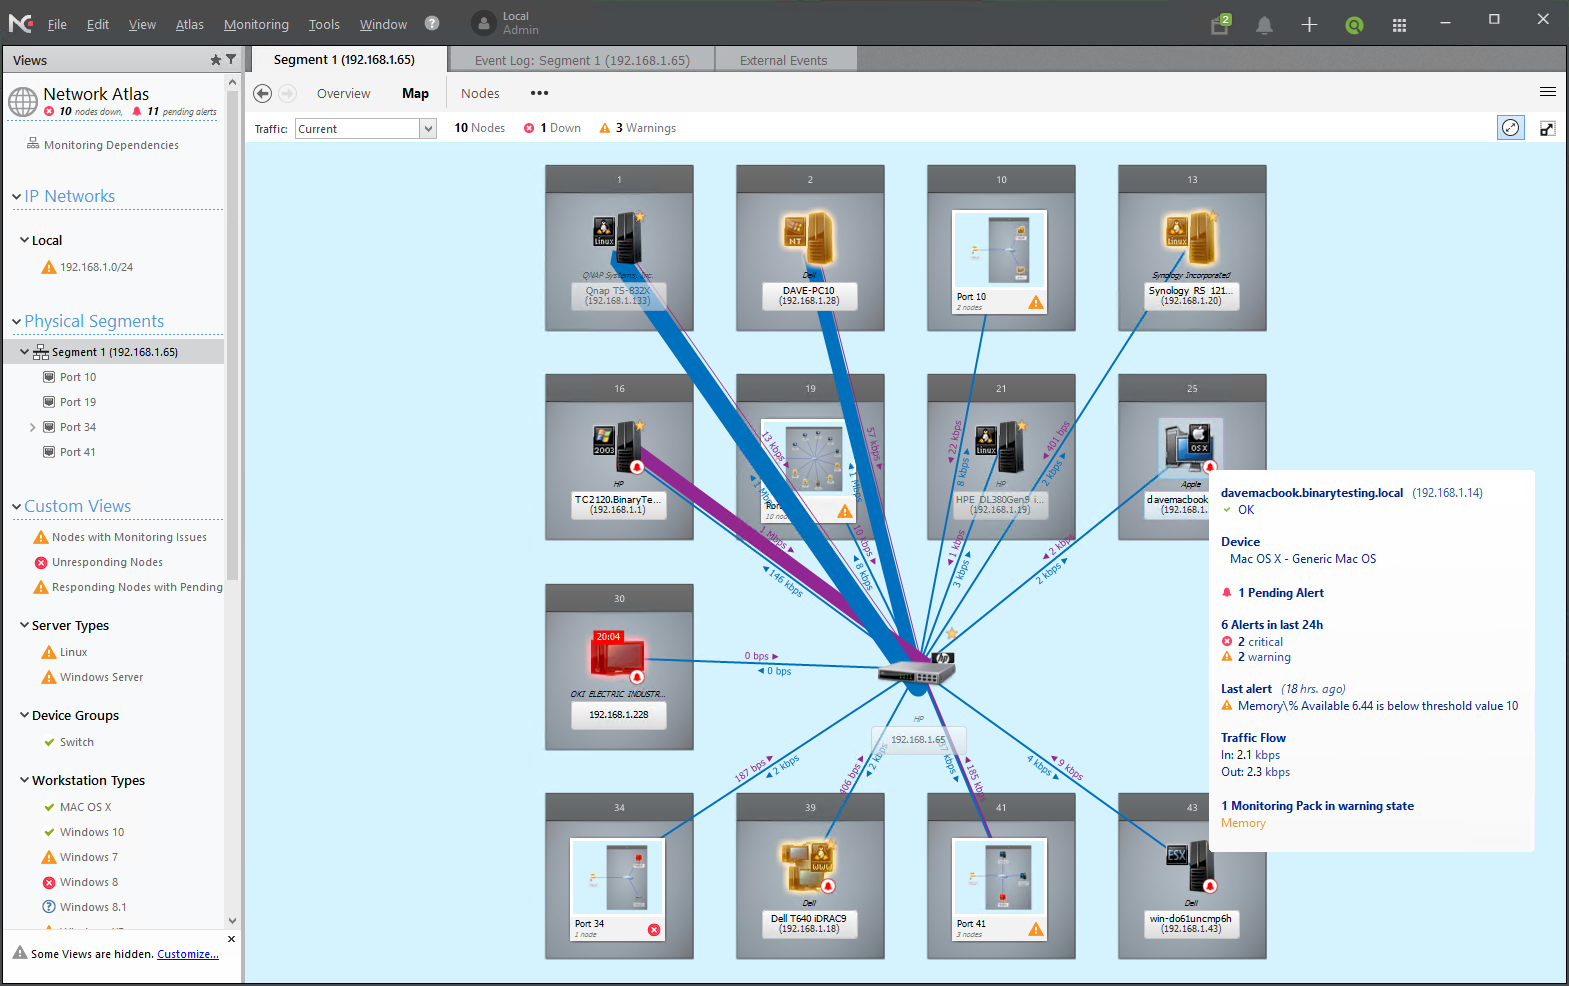
Device identification is spot-on as NetCrunch found all our Windows Server 2012 R2 and 2016 servers, Windows 7 and 10 workstations, VMware ESXi hosts, printers and HPE network switches. It picked up our MacBooks, correctly noted they were running macOS High Sierra and immediately alerted us to the fact that one of them was dangerously low on available memory.
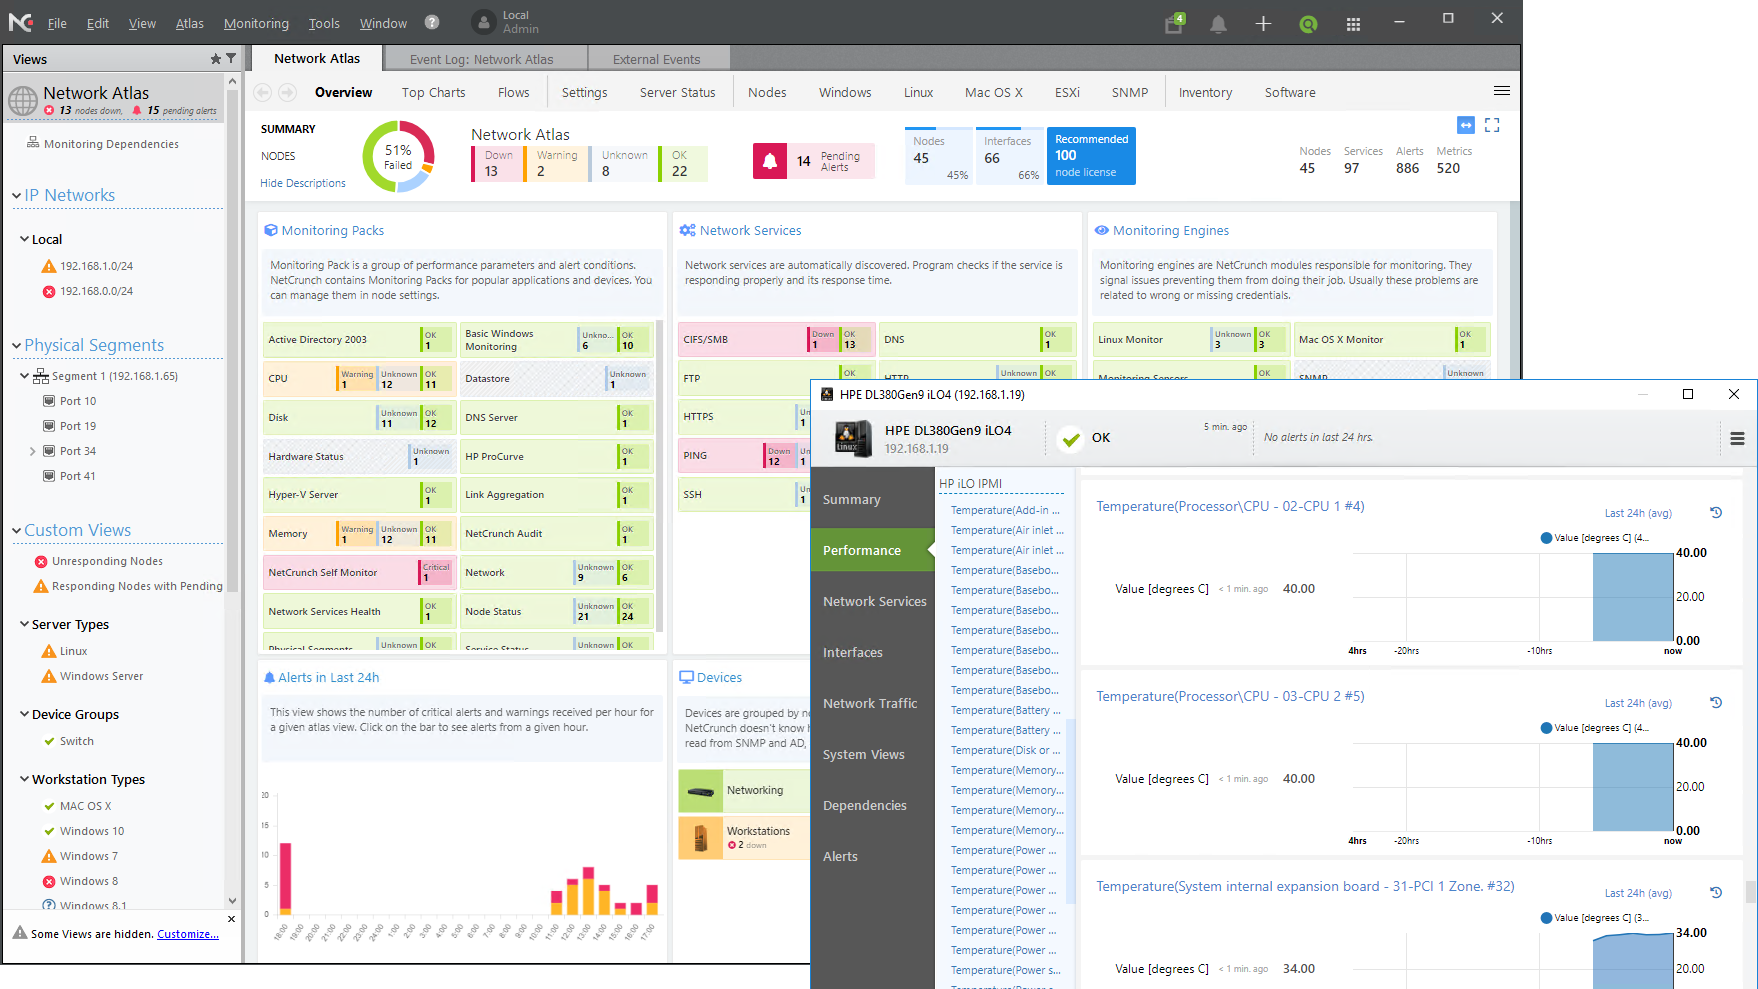
The NetCrunch console Atlas view presents a customisable colour-coded overview of all network devices so you can see at a glance which ones have problems or are down. Smart Pages take this to next level; the Atlas automatically presents you with views based on the content selected in the left pane and the console provides full search facilities, making it easy to find a device of interest.
We quickly pulled up views of our Linux or Windows servers, Windows 10 workstations or Mac devices. Custom pages can be easily created and selecting a network segment in the left pane brings up a Layer 2 map with real-time views of network traffic passing between each node.

NetCrunch still favours VMware systems for virtualized host monitoring. It provided full performance statistics on our ESXi servers along with graphs on datastore usage and the status of every VM plus their resource consumption.
Hyper-V features are still currently limited to displaying details on host CPU utilization and the Hyper-V Windows Management services. Unlike the VMware pack, it can't provide any information about Hyper-V VMs being hosted.
We love the new iLO monitoring pack as after adding it to our HPE ProLiant server devices, it provided alerting services for hardware faults such as fan or power supply failures. Even better, it could access HPE's hardware 'sea of sensors' and show details on fan speeds, the temperature of every critical component and overall power usage.
Along with default and customisable sets of alerting scripts, NetCrunch uses actions to carry out command sets. Basic actions can send an email whereas control actions run programs or scripts and can stop and start a Windows service or reboot a system.
You can easily see which devices need attention as the Top Charts tab shows systems with the highest CPU, memory and storage usage, those with the most pending alerts and any that have high levels of network traffic. If the default displays aren't enough, you can customise the page by creating new dynamic charts, adding selected performance counters and applying device filters.
Large support departments will approve of the free GrafCrunch web server as it provides a big heads-up display of selected nodes showing any performance metric they want. We used it to present real-time graphs of CPU, disk, memory and network usage for our critical Windows servers and were pleased to see that this latest version now fully supports Microsoft Edge.
AdRem's NetCrunch 10.4 offers a remarkable set of network monitoring tools and the new features make it even more versatile. The node-based licensing scheme is affordable for SMBs, deployment is a swift 15-minute task and its highly informative management console means never missing a network problem again.
Verdict
AdRem’s NetCrunch 10.4 offers a remarkable set of network monitoring tools and the new features make it even more versatile. The node-based licensing scheme is affordable for SMBs, deployment is a swift 15-minute task and its highly informative management console means never missing a network problem again.
Windows Server 2008 R2 upwards.
Options: Yearly maintenance, 33% of initial price
Get the ITPro daily newsletter
Sign up today and you will receive a free copy of our Future Focus 2025 report - the leading guidance on AI, cybersecurity and other IT challenges as per 700+ senior executives
Dave is an IT consultant and freelance journalist specialising in hands-on reviews of computer networking products covering all market sectors from small businesses to enterprises. Founder of Binary Testing Ltd – the UK’s premier independent network testing laboratory - Dave has over 45 years of experience in the IT industry.
Dave has produced many thousands of in-depth business networking product reviews from his lab which have been reproduced globally. Writing for ITPro and its sister title, PC Pro, he covers all areas of business IT infrastructure, including servers, storage, network security, data protection, cloud, infrastructure and services.
-
 Westcon-Comstor and Vectra AI launch brace of new channel initiatives
News Westcon-Comstor and Vectra AI have announced the launch of two new channel growth initiatives focused on the managed security service provider (MSSP) space and AWS Marketplace.
By Daniel Todd Published
-
 Third time lucky? Microsoft finally begins roll-out of controversial Recall feature
News The Windows Recall feature has been plagued by setbacks and backlash from security professionals
By Emma Woollacott Published
-
 The UK government wants quantum technology out of the lab and in the hands of enterprises
News The UK government has unveiled plans to invest £121 million in quantum computing projects in an effort to drive real-world applications and adoption rates.
By Emma Woollacott Published