Lucidchart review: Flexible and feature-rich cloud-based diagramming tool
You can do an awful lot with a free account, but some of the most exciting tools are only available on the top-level Enterprise tier
-
+
No design skills required
-
+
Shapes and connectors dynamically reformat as you adjust your chart
-
+
Replicates offline editing conventions in the browser
-
+
Support for layers
-
+
Option to upload your own fonts
-
-
Web-only unless you're signed to the Enterprise plan
-
-
Live data only available in Enterprise plan
-
-
Limited templates and shapes on free tier
Pick the right tool for a job, and you'll usually work faster and produce a better result. So it is with diagramming, by which we don't mean technical drawings for architects or makers, but charts and workflows that describe relationships, processes, and workflows. While you could lay one out in a vector drawing suite, making changes at a later date will usually be more difficult than if you'd used a dedicated tool.
Lucidchard, which is cloud-based and runs through the browser, is built with precisely this job in mind. Rather than focus on a suite of freehand drawing tools, it majors on shapes and vector connectors. Drag the shapes onto your canvas and you can resize and reposition them, then connect or group them, and give them meaning by drawing in data.
Lucidchart review: Price and features
If you just want to dip a toe, you can create as many diagrams as you need with Lucidchart's free plan – on the understanding that only the three most recent remain editable. The rest switch to read-only mode and storage is capped at 25MB. These aren't the only restrictions: you can only add 60 objects to a document and you don't get access to premium shape libraries, which you'll need if you want to use it to mock up Android or iOS apps, user interfaces, timelines, or mind maps.
The individual paid plan, at £8 per month when billed annually (otherwise £9 a month) overcomes each of these limitations. You get 1GB of storage, your documents will always be editable, however many you create, and each can comprise an unlimited number of shapes. Those shapes can be drawn from premium as well as regular libraries, and you can use Lucidchart's premium templates as a starting point if you'd rather not work with a blank canvas.
However, there's no revision history or versioning, you can't password-protect your shared links, and some integrations, including Zoho Connect, are out of reach. There's no way to add these in without opting for a Team license, which starts at a more significant £27 a month when paying for a year upfront (£30 if paying monthly). This covers three team members and, as well as enabling password protection, revision history, and versioning, integrates with Microsoft 365.
Above this sits Enterprise. At £30.17 a month on the annual plan (or £35.98 monthly), it's only slightly more expensive than Team, but only includes two licenses. Considering the additional features, this seems fair enough. As well as everything you get on the Team plan, you get more control over sharing, integration with Salesforce, and access to the Lucidspark collaborative whiteboard.
If you've upgraded to Team or Enterprise, you can also use the Lucidchart apps for iPhone, iPad, and Android. These are free to download, but won't work with the Free or Individual plans, which are restricted to browser use.
Lucidchart review: Getting started
When you first sign up, you can define your role and skill level (novice, intermediate, or proficient), invite colleagues to join, and then pick a chart type or blank canvas as your starting point.
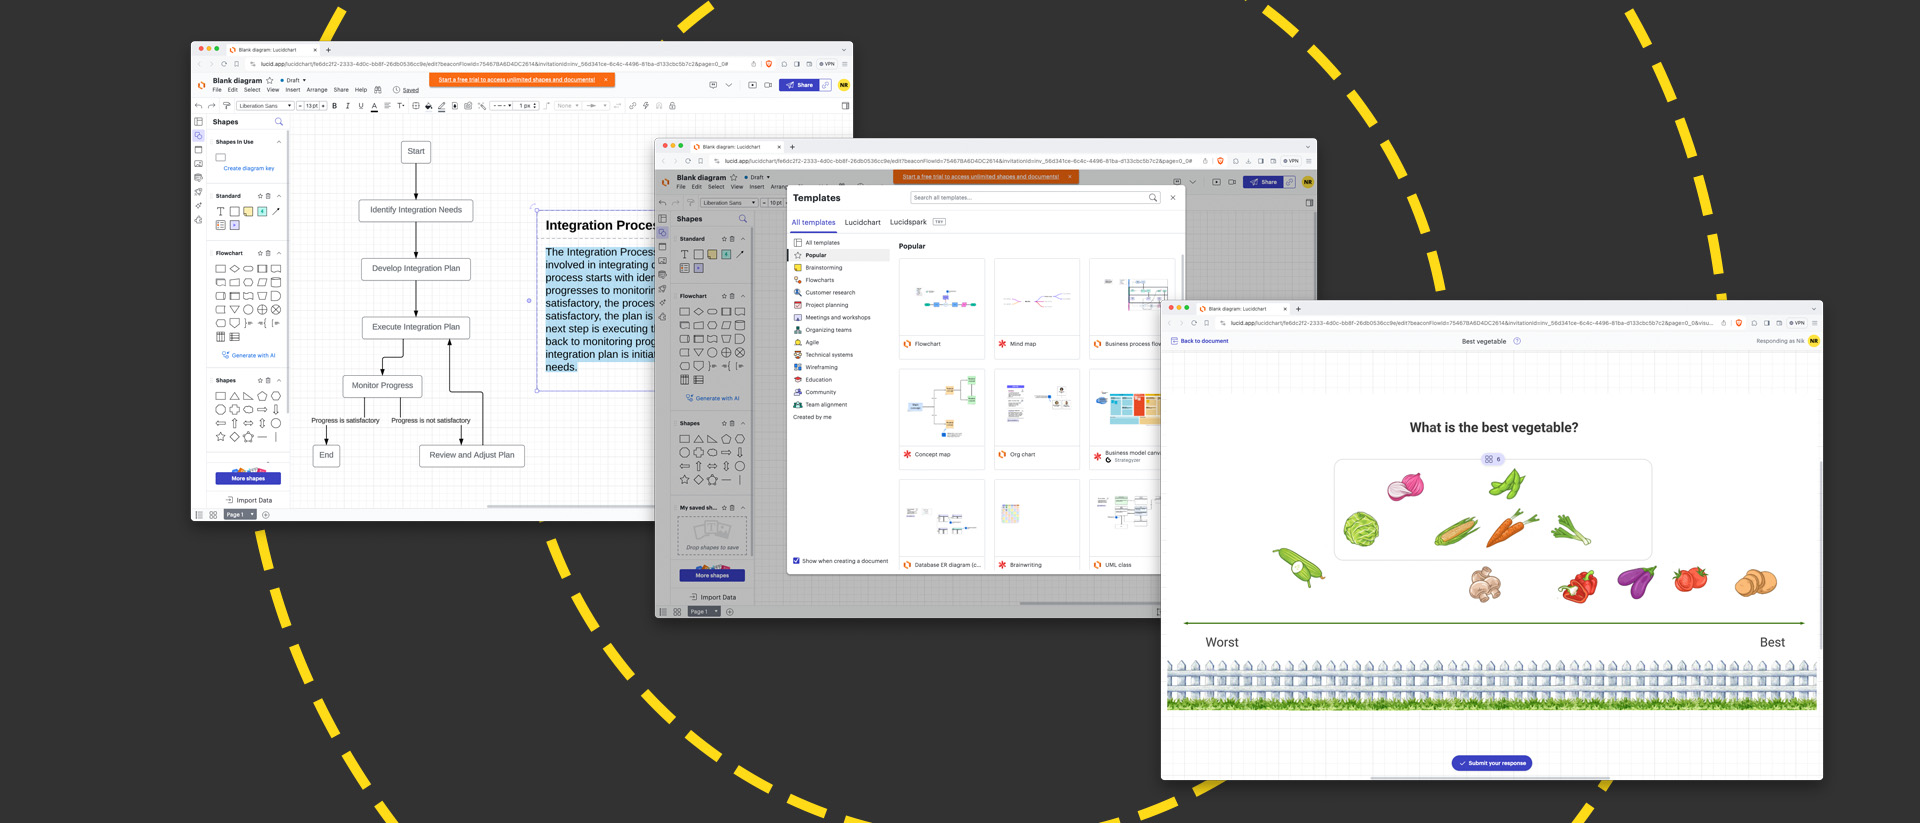
We opted for the wireframing use case to map out a website and, as we were using the free plan, could choose from three templates. If none quite fits your needs, click through the categories in the sidebar to see what else is on offer, or close the template chooser and start from scratch. This isn't as challenging as it might sound, as the interface is logical and well organized, with shapes in the sidebar and styles – for characters, strokes, fills and so on – running across the top.
Your document can contain several pages, which you can click between using tabs at the foot of the window, each with multiple layers. It's easy to protect the work you're happy with as you carry on editing, or to show and hide whole layers when you need to focus on specific features.
Lucidchart review: Creating charts
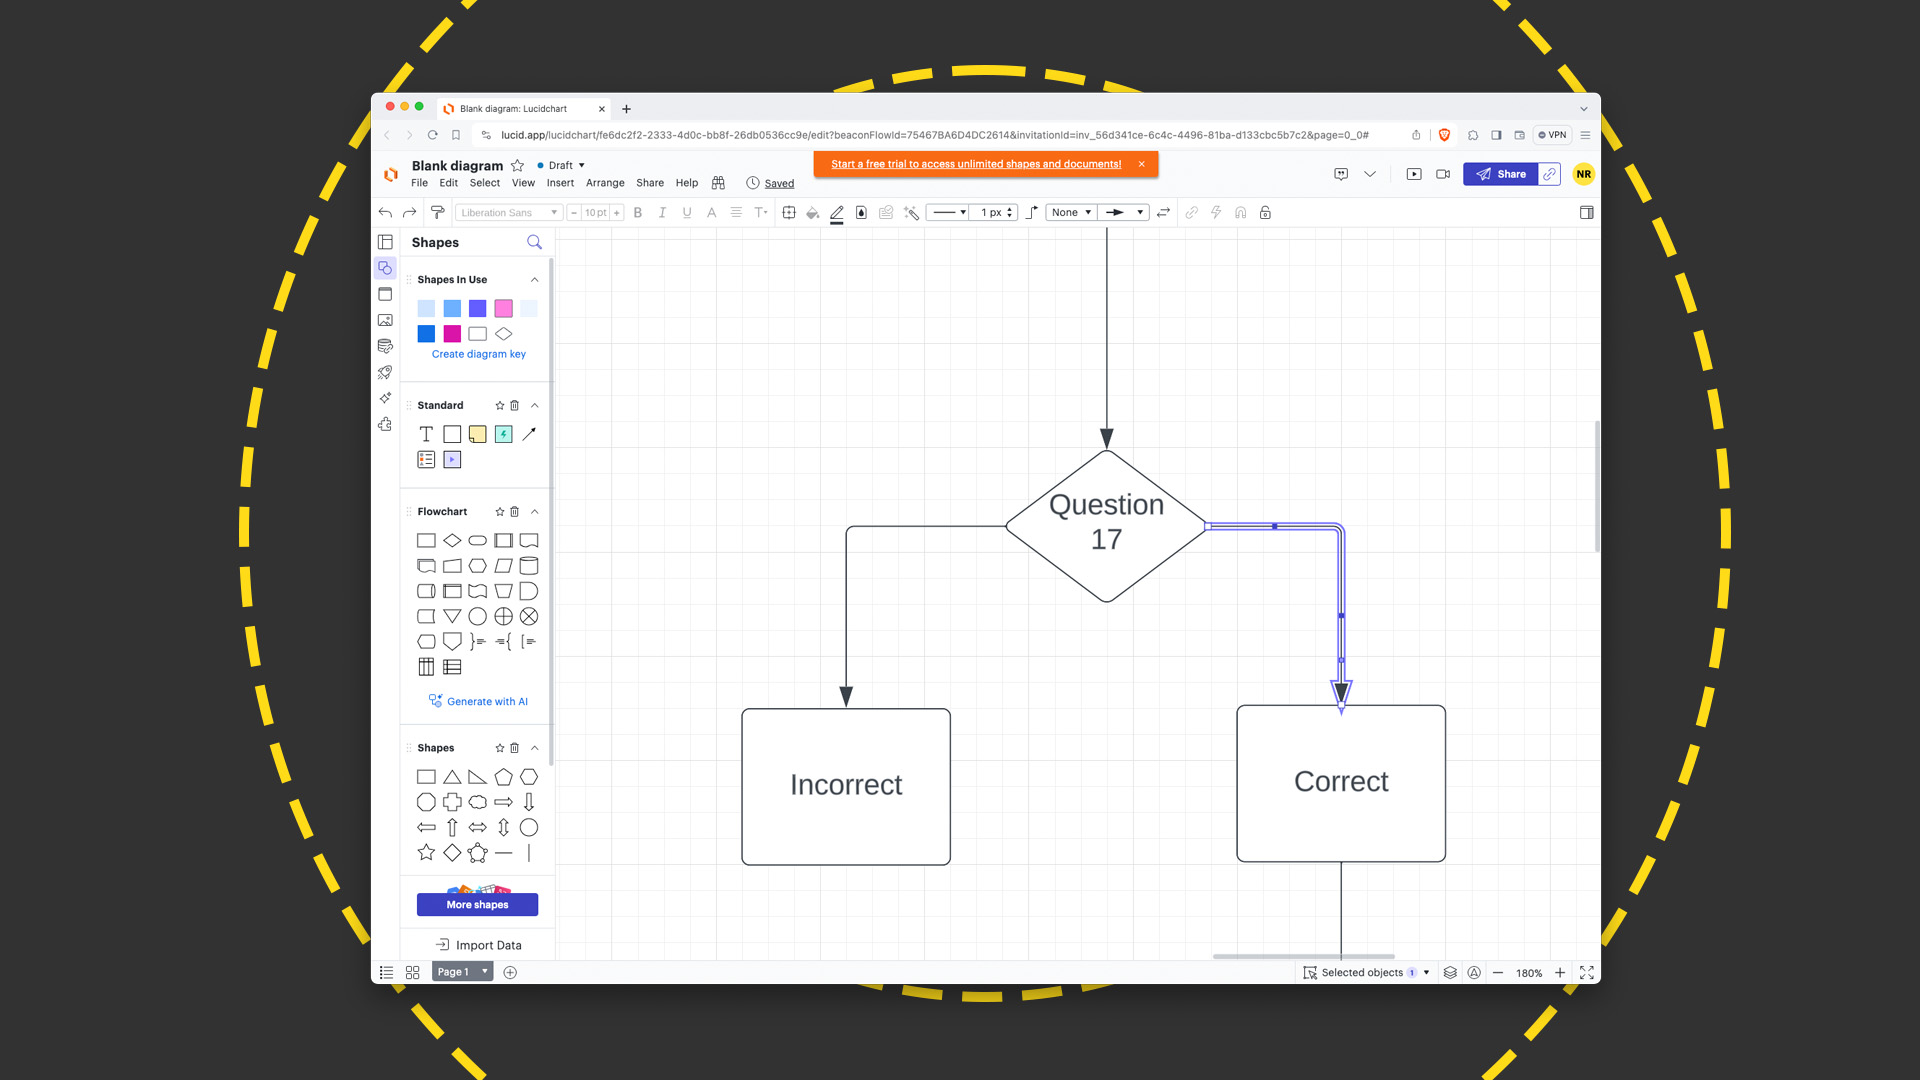
You can click shapes or drag them onto the canvas and, once in situ, reposition and resize them or swap them out by clicking the floating shape icon. Once you've added to your canvas, shapes appear in a dedicated Shapes In Use section at the top of the sidebar, where a single click adds another copy to the page. This is a quick and easy way to keep things uniform.
READ MORE

Indeed, one of the most obvious benefits of a drawing tool like this is the way it standardizes elements and keeps them aligned, making your chart easier to edit, read, and understand. Drag a shape around canvas and guides appear when it's in horizontal or vertical alignment with the center or edge of any other. And, when you link objects to show a customer journey, site map, decision points in code, and so on, the connectors likewise snap to center points on the edge of each object. So, if you have a decision icon (traditionally a diamond) feeding three potential processes (rectangles), all you need to do is drag the tail ends of three connectors to three points of the diamond, and the arrow points to the process boxes. They snap together as though they were magnetic. You can single-click any element within this arrangement to edit or delete it but, until it's removed, it's dynamically linked to its neighbor. So, dragging the decision element will redraw all of the connectors on the fly to maintain the links to each process. And, if you drag one process element because its connector is shorter than the one protruding from the opposite side of the decision object and you want to tidy things up, the two will be highlighted when they match. Touches like this, which are immediately familiar from offline tools, are significant timesavers and very welcome in a cloud-based implementation.
There's a huge range of built-in fonts, and one particularly welcome feature is the option to upload your own. If you have a house style that must be maintained, this means there's no need to export in an interim format and swap out the text before making your presentation.
As your chart becomes more complex, you might want to split your objects across multiple layers, and could even use those layers to implement different options within a work in progress. Each can be hidden and restored to the canvas with a single click in the layers palette, at which point the canvas itself starts behaving more like a live sketchbook, where multiple ideas are kept together and only your preferred options are included in the final export.
Surprisingly – and a little disappointingly – when you switch to a layer, the objects on it don't immediately take focus. If you want to move them as a group, then, you'll need to enclose them within a marquee, then drag. If you don't need to move them, selecting them this way also gives you the option of switching out every shape, even if they're a random selection to start with, or to rotate the group by dragging the arrow at one corner. Holding shift while doing this snaps the rotation at 45-degree increments.
Lucidchart review: data, integrations and AI
The simplest integrations are import and export tools for Visio, and import tools for OmniGraffle and draw.io. Beyond these, there's a library of add-ons that you can integrate through the built-in Marketplace. This includes connections to commonly used SaaS applications, like Google Workspace, Microsoft 365, and Atlassian products including Trello. You can also work with OneDrive, Dropbox, and Box, as well as Slack, to help integrate your teamwork in Lucidchart with an existing workflow.
Beyond bespoke integrations, some data tools are limited on all but the Enterprise plan. You can drag and drop data in the Free, Individual, and Team plans, for example, but it's not updated the next time you open the file. This is disappointing if your data is stored in the cloud in the first place, as the option to open a Lucidchart document and have it automatically redraw to accommodate live metrics would be particularly welcome.
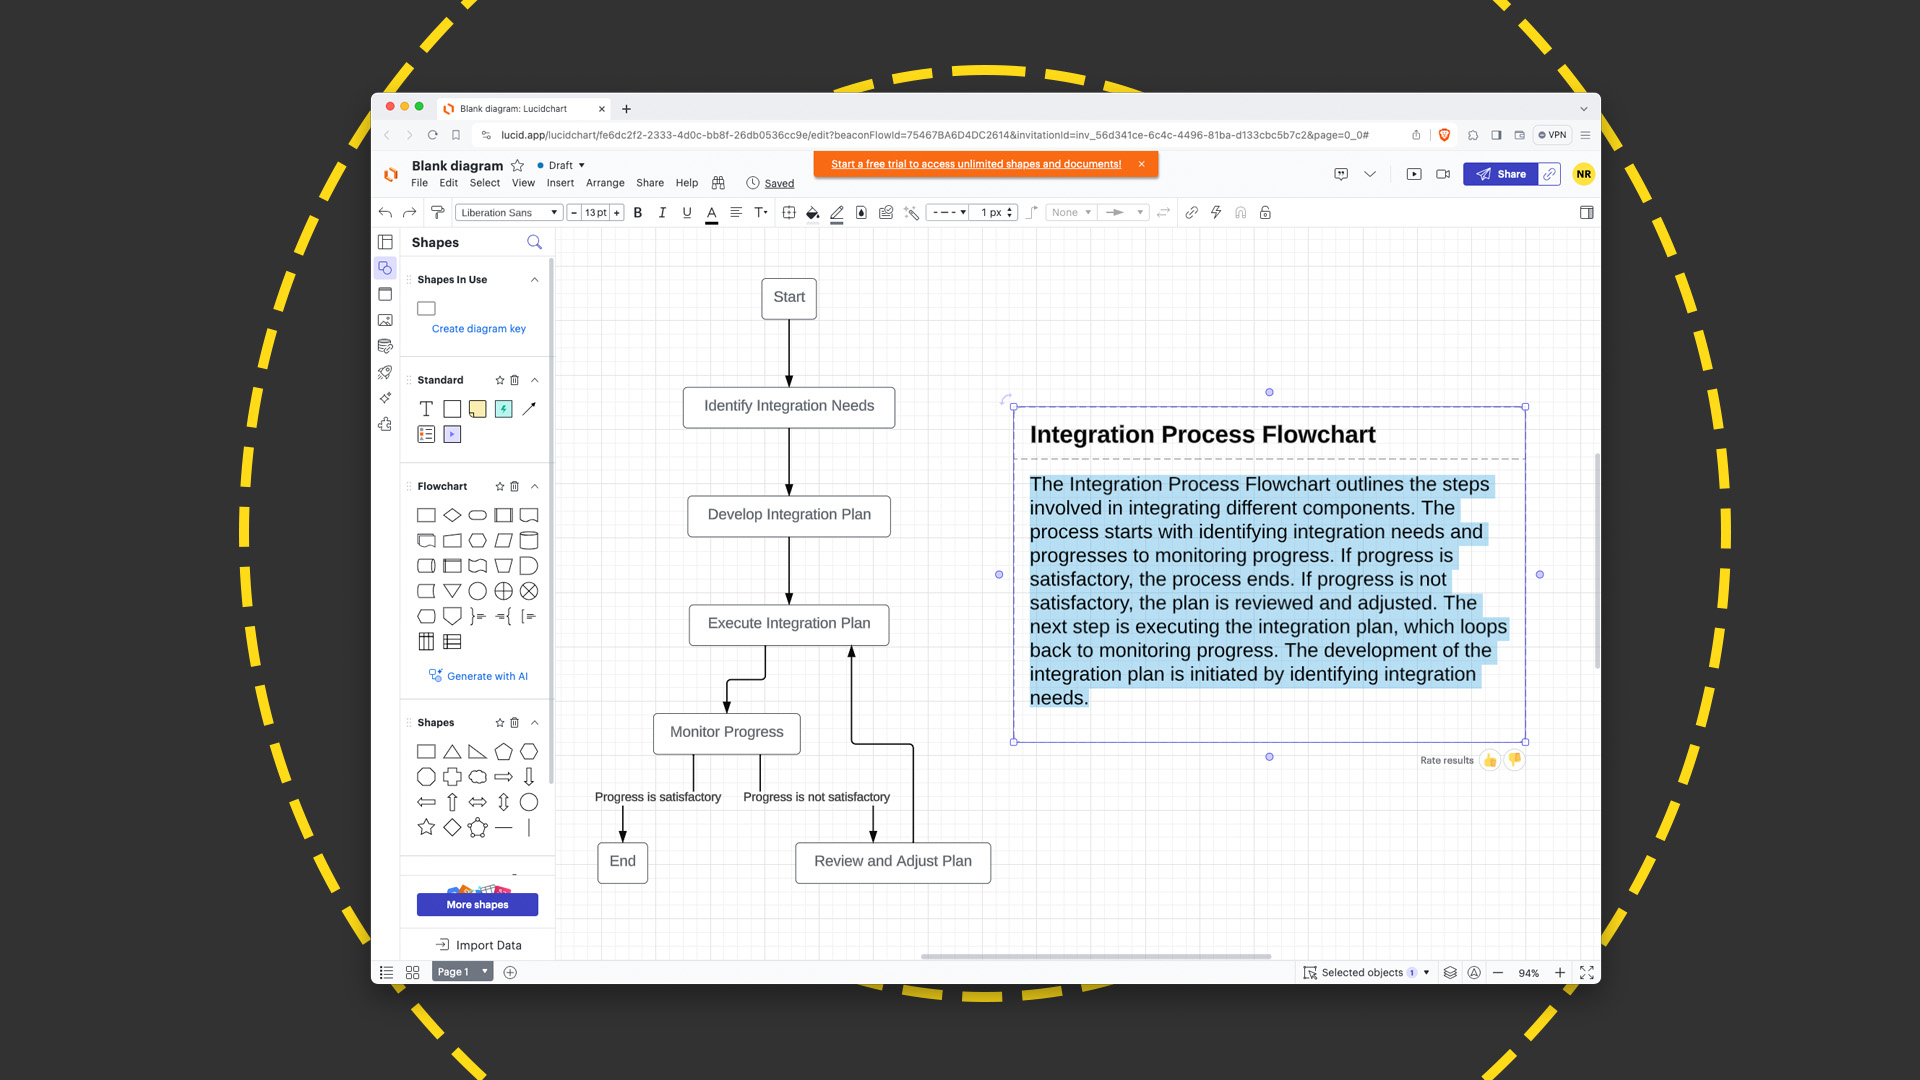
AI is becoming more common in big-name web apps, so it's no surprise to see it appear here. Its most obvious implementation is in the flowchart tool, in which you complete the prompt 'Draw a flowchart about...' and it adds the necessary steps to your diagram, along with required connectors. This is surprisingly knowledgeable. We tried to fool it by asking it to outline the process you should follow when you've had a car crash, buying a new house, or hiring new staff, and the outcomes were logical in every instance. They might not always have been as fleshed out as we'd like, but they were a good starting point on which to build. If this is essential, you'll need to upgrade to the Enterprise plan – as you will if you want to import data from Google Sheets, Excel, Salesforce, or CSV.
You can also use AI to describe your diagram, by dragging a selection around a portion of the chart and picking Summarize from the context menu. The result is natural, flowing English, which may help the less visually inclined to understand your work if it's part of a presentation.
Lucidchart review: sharing your work
You can share directly from the toolbar, as you can in Google Drive, and set each collaborator's permission level so they can view, add comments, make edits, or both edit and share the file themselves. If you prefer to make the document public rather than restricting it to specified individuals, you can apply the same restrictions to your public link.
Both a chart's owner and anyone who's been invited to collaborate can add comments, which can be pinned to specific shapes or applied to the overall document. Anyone specifically mentioned (with an @) will receive an alert by email and, if the comment is attached to a shape, selecting it and clicking the pin at the top of the comments panel refocuses the document to frame the object in question.
On the Team and Enterprise plans, every change is tracked, and the date and time it was made – and by whom – is registered alongside the edit. If anyone takes things too far, you can roll back through the version history to reinstate a former state, or generate a new document from that point for parallel editing. You can share your work on every tier, but you'll need to sign up to the Team or Enterprise tiers if you want to add a password or set the share link to expire.
RELATED WHITEPAPER

When you've finished editing your chart, you can export it in a wide range of standard formats, including raster-based Jpeg or PNG, and vector-based PDF and SVG. And, if it's to be a jumping-off point for future projects, you can convert your work to a template. Beyond that, you can reformat it as a presentation and export it to Google Slides, or share videos of your screen and camera if the slide needs explanation.
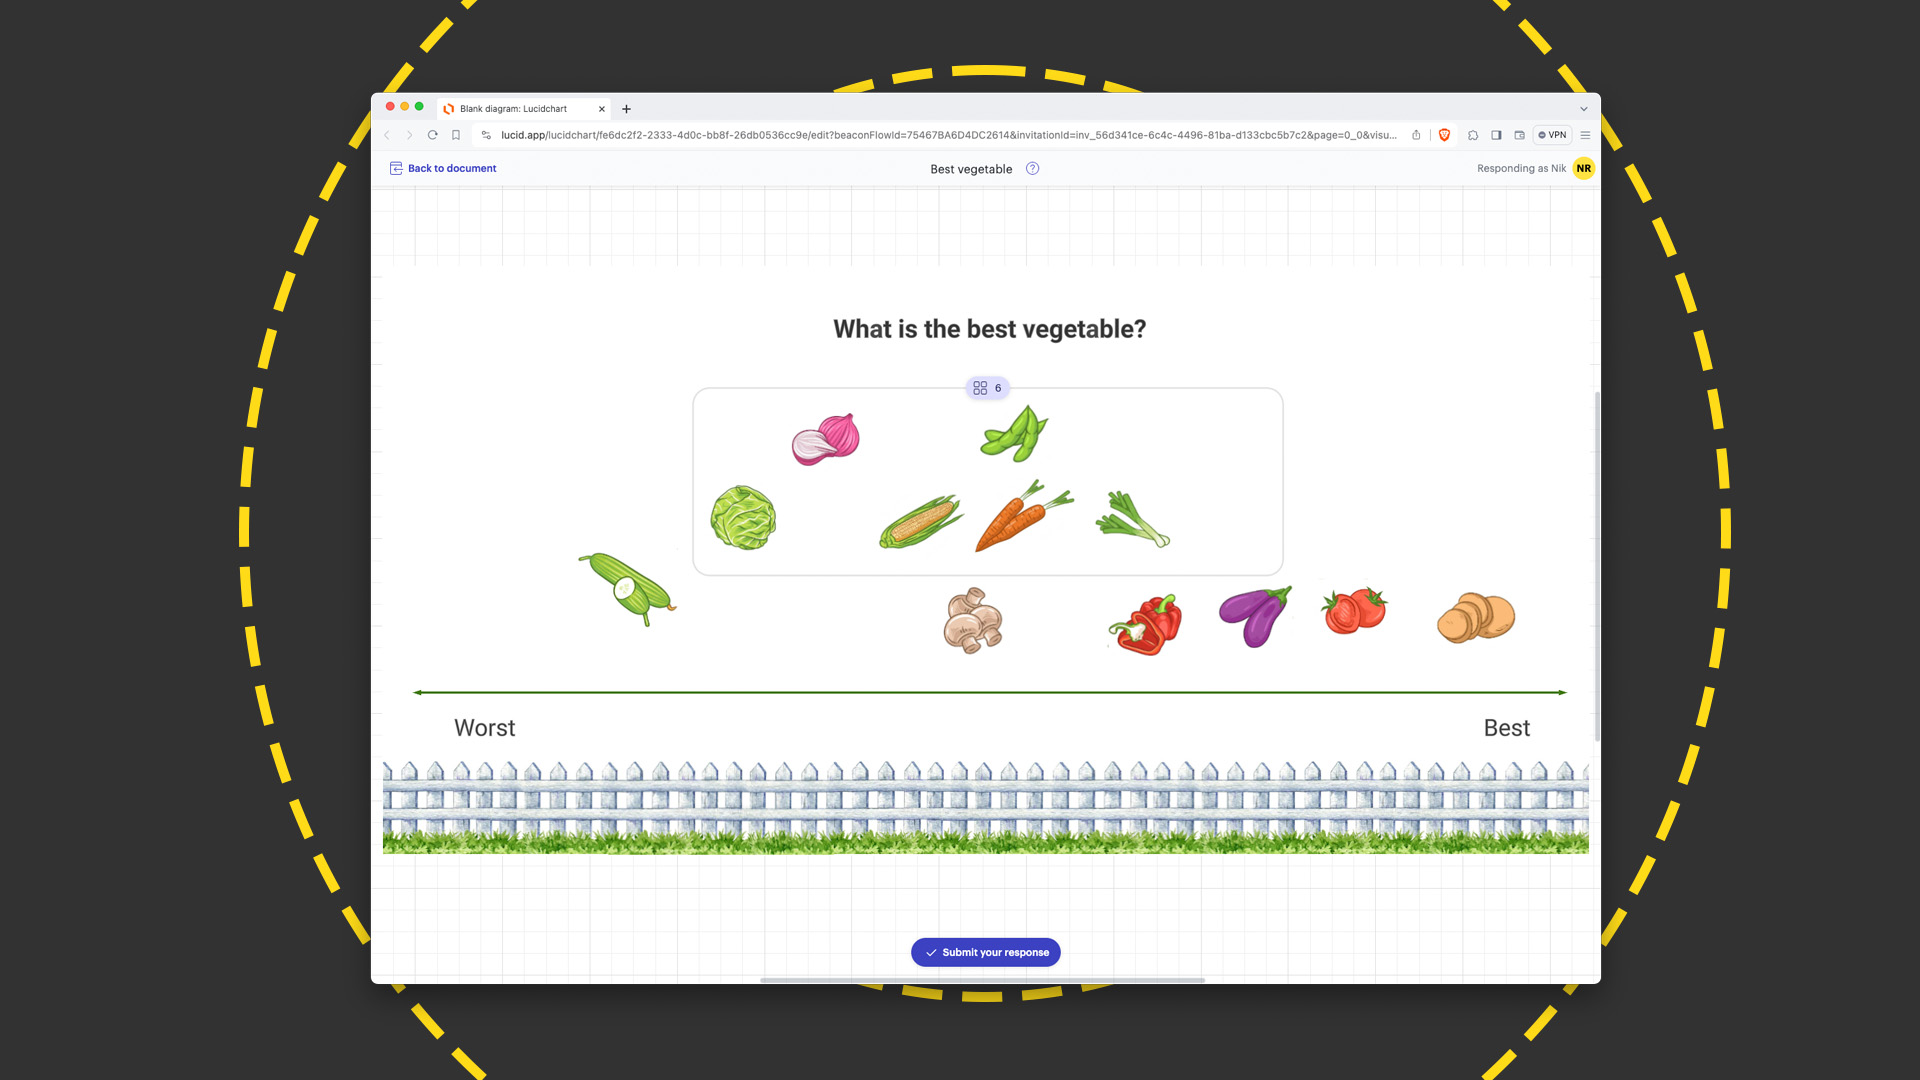
Another collaboration feature is the built-in Visual Activities tool, which lets you drag pre-defined (but tweakable) applets with which collaborators can interact. These vary from common business tools, like matrices and charts for prioritizing activities, to ice breakers for team building, like ranking vegetables or picking a favorite restaurant.
Lucidchart review: Is it worth it?
Whether you're planning a project, mapping a routine before you start coding, drawing an org chart for your business, or working on a family tree, there's plenty to like here. Even if you're not paying, Lucidchart is flexible, powerful, and easy to use, with an expanding canvas, layers, multi-page documents, and a wide selection of shapes and connectors.
True, some of the most compelling features are restricted to paid accounts, which is to be expected, although we do think limiting live data to Enterprise is disappointing. If you're not upgrading to Enterprise, you'll also need to do your work through a browser – regular or mobile – but we can't see why this should limit your creativity.
Just bear in mind the 60-shape cap on the free tier, which we bumped up against in our tests, and the limit of three editable and an unlimited number of read-only documents. If either is an issue, you'll need to upgrade – but, at £96 a year, the price of the Individual tier strikes is very fair indeed.
Get the ITPro daily newsletter
Sign up today and you will receive a free copy of our Future Focus 2025 report - the leading guidance on AI, cybersecurity and other IT challenges as per 700+ senior executives
Nik Rawlinson is a journalist with over 20 years of experience writing for and editing some of the UK’s biggest technology magazines. He spent seven years as editor of MacUser magazine and has written for titles as diverse as Good Housekeeping, Men's Fitness, and PC Pro.
Over the years Nik has written numerous reviews and guides for ITPro, particularly on Linux distros, Windows, and other operating systems. His expertise also includes best practices for cloud apps, communications systems, and migrating between software and services.
-
 Women show more team spirit when it comes to cybersecurity, yet they're still missing out on opportunities
News While they're more likely to believe that responsibility should be shared, women are less likely to get the necessary training
By Emma Woollacott Published
-
 OpenAI wants developers using its new GPT-4.1 models – but how do they compare to Claude and Gemini on coding tasks?
News OpenAI says its GPT-4.1 model family offers sizable improvements for coding, but tests show competitors still outperform it in key areas.
By Ross Kelly Published
-
 Meta just revived plans to train AI models with European user data – here’s how you can opt out
News Meta has confirmed plans to train AI models using European users’ public content and conversations with its Meta AI chatbot.
By Nicole Kobie Published